
App Performance Metrics: a 2026 Guide for Product Teams
TL;DR:
- Most mobile users churn within 30 days without informing developers of the reasons for their departure. Critical performance metrics include crash and ANR rates above 99.5% and 99.7%, respectively, and percentile-based latency targets like p95 and p99. Segmenting data by device, OS, and geography reveals hidden issues, enabling teams to align performance goals with product roadmaps effectively.
Most product teams assume they know when their app is performing poorly. Users complain, reviews drop, and someone files a bug. But over 95% of mobile users churn within 30 days, and most of them never tell you why. App performance metrics are what stand between silent attrition and a product that actually retains users. This guide cuts through the noise on which metrics matter, how to measure them accurately, and how to translate raw data into decisions that move your product forward.
Table of Contents
- Key takeaways
- Core app performance metrics and how to measure them
- User experience metrics linked to performance
- Infrastructure and system resource metrics
- Integrating metrics into product workflows
- My take on where most teams get performance measurement wrong
- Turn your performance data into product wins with Gostellar
- FAQ
Key takeaways
| Point | Details |
|---|---|
| Crash and ANR benchmarks are non-negotiable | Aim for a crash-free rate above 99.5% on Android and 99.7% on iOS to protect store visibility. |
| Latency targets need percentile precision | Track p95 and p99 thresholds, not just averages, to catch the slowdowns that drive real users away. |
| Engagement metrics reveal what technical data misses | Correlate DAU, session length, and retention rates with technical performance to identify root causes of drop-off. |
| Segmentation uncovers hidden problems | Splitting metrics by device, OS, and geography often reveals issues that aggregate data conceals entirely. |
| Metrics should feed your roadmap, not just your dashboards | Tie performance thresholds to product-level service objectives so engineering priorities align with business goals. |
Core app performance metrics and how to measure them
Technical health is the foundation of any serious application performance analysis. Without reliable data here, everything upstream in product decisions is built on assumptions.
Crash rate and ANR rate are your first line of signal. Apps exceeding a crash rate of 1.09% or an ANR rate of 0.47% risk reduced visibility in the Play Store, which means fewer installs before users even have a chance to experience the problem. Enterprise benchmarks put the crash-free rate target at 99.5% for Android and 99.7% for iOS. These numbers are not aspirational. They are the floor.
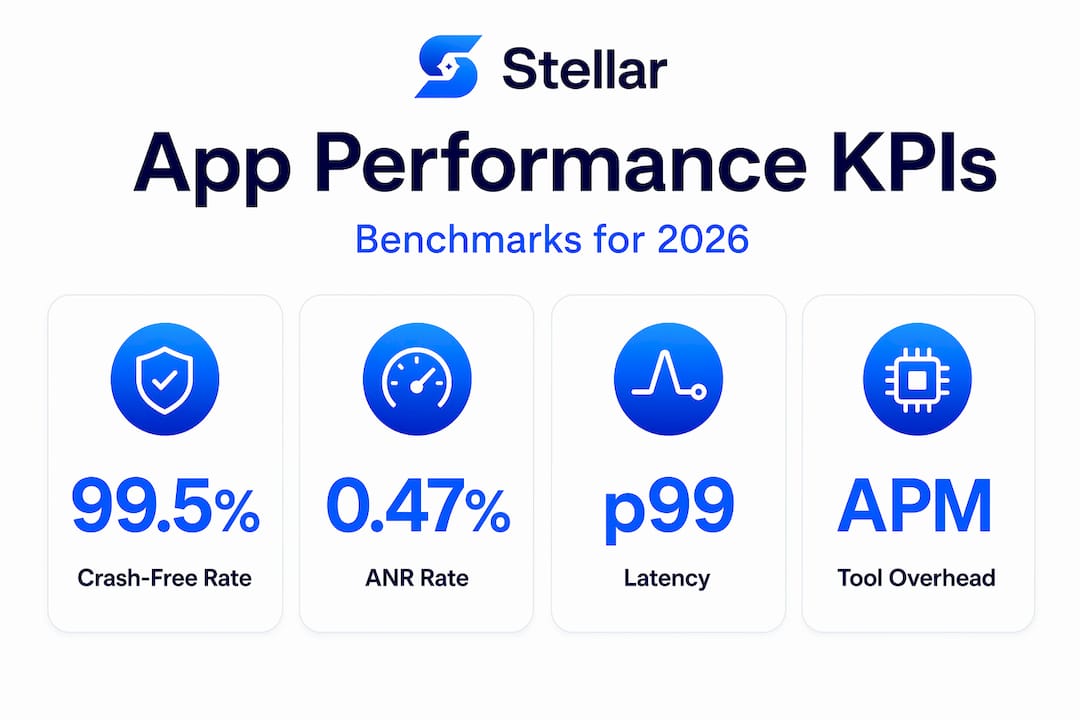
Latency is where most teams go wrong. Averaging response times is practically useless because the mean hides your worst-performing users. You want percentiles. Customer-facing APIs target p95 latency under 300 to 500ms and p99 under 1 second, with server-side error rates kept below 1%. A user landing in that 99th percentile is slow every single session. That user churns.
Key technical metrics to instrument from day one:
- Crash-free rate: Percentage of sessions that complete without a crash. Segment by OS version and device class.
- ANR rate: Tracks when the app freezes, a signal that the main thread is blocked.
- p50, p95, p99 latency: Response time distributions for API calls and in-app transactions.
- Error rate: The ratio of failed requests to total requests. Monitoring response time, throughput, and error rate together pinpoints bottlenecks that no single metric surfaces alone.
- Throughput: Requests per second processed by your backend, a direct indicator of scalability under load.
Platform differences matter more than most teams acknowledge. Android fragmentation means your p99 latency on a budget device running Android 10 can be four times worse than on a flagship running Android 14. iOS tends to be more uniform, but OS update cycles create short-term regression spikes you need to monitor proactively.
For tooling, Firebase Crashlytics gives you free, high-quality crash reporting for both platforms. Google Play Console provides ANR and crash dashboards tied directly to store performance signals. For deeper APM coverage including latency distributions and error tracing, purpose-built solutions give you the full picture.
Pro Tip: Set separate performance thresholds by device tier in your monitoring dashboards. What is acceptable on a 2024 flagship is a crash waiting to happen on a mid-range device from three years ago.
User experience metrics linked to performance
Technical metrics tell you what broke. User experience metrics tell you what it cost you.
Performance metrics segmented by device, OS, and geography are where the real story lives. An app that performs well in aggregate can be silently failing a specific user segment. Here is how to connect the technical layer to the behavioral layer:
- Daily Active Users (DAU) and Monthly Active Users (MAU). The DAU/MAU ratio, sometimes called stickiness, tells you whether users who install the app actually find reasons to come back. A stickiness ratio below 20% usually signals either a product problem or a performance problem. You need to distinguish between them.
- Retention rate. Measure Day 1, Day 7, and Day 30 retention separately. A sharp drop between Day 1 and Day 7 often correlates with onboarding friction or early crash events, not content quality.
- Session length and depth. Short sessions can mean users got what they needed fast (good) or gave up (bad). Context matters. Pair this metric with task completion rates and funnel drop-offs to interpret it accurately.
- Churn rate. Defined as the percentage of users who stop using the app within a given period. Because more than 95% of users churn within 30 days, even modest improvements to app load time and crash-free rate measurably shift this number.
When you segment engagement data by performance cohort, the patterns become stark. Users who experience a crash within the first session are dramatically less likely to return, regardless of how good the core product is. Users on slow network connections who encounter loading states longer than 3 seconds drop off at rates that outpace any UX copy improvement you could make.
To connect this to your web application performance testing process, run regular cohort analyses that cross performance events with downstream retention data. If you do not have this instrumented already, it is the highest-ROI analytics work you can prioritize this quarter.
Pro Tip: Build a single retention dashboard that flags performance events (crashes, slow loads) alongside behavioral cohort data. When both trend downward together, you have a performance problem. When only behavior drops, the product needs attention.
Infrastructure and system resource metrics
Backend and device resource metrics do not always make it into product conversations. They should.

CPU and memory utilization sit at the core of application stability. CPU utilization sustained above 70 to 80% reliably predicts latency spikes and service degradation. You do not wait for an incident to act on that signal. You scale or optimize before it affects users.
The metrics that belong in every infrastructure monitoring setup:
- CPU utilization: Track average and peak. Peak spikes during high-traffic events are often the first sign of a threading or caching issue.
- Memory usage and leak detection: Memory leaks on mobile are especially destructive because they accumulate across sessions and cause crashes that appear random to users.
- Network throughput and latency at the infrastructure layer: Separate from your API-level latency metrics, this tells you where slowdowns originate. A congested database query looks very different from a third-party dependency timeout.
- Disk I/O rates: Particularly relevant for data-heavy apps. Sustained high disk I/O often indicates inefficient query patterns or unnecessary local caching.
One framework worth adopting is the combination of RED metrics (Rate, Errors, Duration) with USE metrics (Utilization, Saturation, Errors) for root cause analysis. RED gives you the user-facing view. USE gives you the resource constraint view. Using them together means you can trace a user-reported slowdown back to its actual system cause in minutes rather than hours.
On tooling overhead: APM tools introduce roughly 2 to 3% CPU and memory overhead. That is a real cost, but one that pays for itself the moment you catch a production issue before your users report it. Do not let concerns about instrumentation overhead lead you to under-monitor.
Integrating metrics into product workflows
Measuring app performance metrics is table stakes. Operationalizing them into your development workflow is where the real leverage lives.
| Approach | Reactive teams | Proactive teams |
|---|---|---|
| Crash thresholds | Respond after user reports | Alert triggers before store impact |
| Latency monitoring | Check after complaints | SLOs tied to release gates |
| Engagement correlation | Monthly review | Real-time cohort dashboards |
| Performance testing | Pre-release only | Integrated into CI/CD pipeline |
| Metric segmentation | Aggregate only | By device tier, OS, and geography |
Setting service-level objectives (SLOs) is the bridge between engineering metrics and product accountability. An SLO for your checkout flow that says "p95 latency must stay below 400ms for 99.9% of 28-day windows" gives engineers a specific, defensible target and gives product managers a signal tied to user experience quality.
Full-stack observability combining metrics, logs, and traces establishes baselines and detects disruptions well before users notice them. This goes beyond dashboards. It means your monitoring system can tell you not just that something is slow, but why it is slow and which users are affected.
Automated performance testing in your CI/CD pipeline is another high-impact practice. If every pull request runs a performance regression suite, you catch slowdowns at the code level, not in production. The investment is roughly three to five engineering days to set up and pays back in avoided incidents.
For teams tracking mobile app KPIs at the product strategy level, integrating performance data into roadmap planning changes how priorities get set. When you can show that improving cold start time from 3 seconds to 1.5 seconds is correlated with a 12% lift in Day 7 retention, performance work competes on equal footing with feature development.
Pro Tip: Review your top three performance regressions from the past quarter before every roadmap planning session. You will consistently find that the fixes deliver more retention value than the new features you were planning to ship instead.
My take on where most teams get performance measurement wrong
I have watched product teams spend months optimizing the wrong layer. The pattern repeats: someone notices slow UI rendering, the team spends two sprints improving animations, and the actual problem was a blocking network call on app launch that no one had thought to measure. Mapping symptoms to root causes before committing engineering resources is not a process nicety. It is the difference between shipping improvements that users notice and shipping work that looks good in a retro but moves no metrics.
What I have found most consistently true is that treating app performance metrics as a product strategy pillar changes the culture of how teams make decisions. When performance data lives in the same planning conversation as feature requests, teams stop treating reliability as a tax and start treating it as a competitive advantage.
The other underrated discipline is continuous segmentation. Aggregate metrics lie. A crash-free rate of 99.6% looks great until you segment by Android 11 on Qualcomm devices and find it is 97.2%. That segment might represent 30% of your user base. You will never see it without the right slicing.
My honest advice: do not build dashboards nobody checks. Build one concise view that surfaces the metrics tied to your current SLOs, flags anomalies automatically, and gets reviewed in every sprint review. Less is more here. Three metrics that drive decisions beat thirty metrics that get scrolled past.
— Juan
Turn your performance data into product wins with Gostellar
If your performance monitoring is producing data but not driving decisions, the gap is usually at the experimentation layer. You know what is slow. The question is whether your fixes actually move user behavior.

Gostellar gives product teams and growth marketers a fast, lightweight way to test changes against real user cohorts, without waiting on development resources. Its A/B testing for user experience connects directly to the kind of engagement and conversion metrics you have been building in your performance dashboards. Whether you are testing a faster checkout flow, a redesigned onboarding sequence, or a performance-driven UI change, Gostellar's real-time analytics show you what the numbers actually mean for retention and conversion. Start for free and close the loop between performance measurement and product improvement.
FAQ
What are the most important app performance metrics to track?
Crash-free rate, ANR rate, p95/p99 latency, error rate, and Day 1/Day 7/Day 30 retention are the core metrics. Technical stability and user-facing engagement data must be tracked together to understand true app health.
What is a good crash-free rate for mobile apps?
Enterprise benchmarks target a crash-free rate of at least 99.5% for Android and 99.7% for iOS. Rates below these thresholds risk reduced Play Store visibility and measurable user trust erosion.
Why should I track p95 and p99 latency instead of average?
Averages mask your slowest users. P95 and p99 thresholds represent the experience of your worst-affected cohorts, which are precisely the users most likely to churn if performance is not addressed.
How do I connect technical metrics to user retention?
Segment your retention cohorts by users who experienced a crash, a slow load, or an ANR event in their first session. The retention gap between clean-session users and degraded-session users will tell you exactly how much your technical issues cost in user lifetime value.
How much overhead do APM monitoring tools add?
APM tools typically add 2 to 3% in CPU and memory overhead. For most production apps, this trade-off is well justified given the speed at which root cause analysis becomes possible when an incident occurs.
Recommended
Published: 5/18/2026