
A/B Significance Test: What Marketers Must Know
TL;DR:
- Many marketers mistakenly interpret statistically significant results as guaranteed business wins, which is often false. Proper A/B testing requires careful planning of sample size, confidence levels, and understanding the difference between statistical and practical significance. Bayesian methods and full-cycle testing improve reliability, especially for low-traffic sites, leading to more meaningful and actionable insights.
Most marketers run an A/B significance test, see a green checkmark in their dashboard, and call it a win. The problem is that a result can be statistically significant and still be completely worthless to your business. Misreading significance is one of the most common and costly mistakes in data-driven marketing. This article breaks down the core principles of A/B testing statistical significance, covers the pitfalls that derail even experienced analysts, and gives you a practical framework for running tests that actually tell you something real.
Table of Contents
- Key takeaways
- A/B significance test fundamentals
- Common mistakes in interpreting A/B test results
- Designing A/B tests that actually work
- Practical significance and industry benchmarks
- When standard A/B testing does not fit
- My honest take on A/B significance testing
- Run smarter A/B tests with Gostellar
- FAQ
Key takeaways
| Point | Details |
|---|---|
| p < 0.05 is the standard threshold | The 95% confidence level is the industry baseline, but high-stakes decisions like pricing warrant 99%. |
| Sample size determines reliability | Under-powered tests produce unreliable results; proper planning prevents false positives and wasted effort. |
| Statistical ≠ practical significance | A statistically significant result with a tiny lift may not justify the cost of implementation. |
| Bayesian testing helps low-traffic sites | Bayesian methods give SMEs earlier, actionable probability estimates without waiting for large sample sizes. |
| Early stopping corrupts results | Peeking and stopping tests before the planned duration inflates false positives and misleads decisions. |
A/B significance test fundamentals
Statistical significance is the answer to one question: could this result have happened by random chance? When you run an A/B test, users are randomly assigned to a control (version A) or a variant (version B). You measure a goal, say, conversion rate, and then ask whether the difference you see is real or just noise.
The core metric is the p-value. It tells you the probability of observing a result at least as extreme as yours if there were actually no difference between the two versions. A p-value of 0.05 means there is a 5% chance the result is due to random chance. The 95% confidence level with p < 0.05 is the accepted industry standard. For decisions with high financial stakes, such as changing your pricing page, many teams push that to 99% confidence.
Confidence level and p-value are two sides of the same coin. A 95% confidence level means you accept a 5% chance of a false positive, called a Type I error. Lowering that threshold increases your confidence but requires more data.
Here is what goes into a proper significance calculation:
- Baseline conversion rate: Your current conversion rate before any changes
- Minimum detectable effect (MDE): The smallest lift you actually care about detecting
- Statistical power: Usually set at 80%, which means a 20% chance of missing a real effect (Type II error)
- Confidence level: Typically 95%, meaning p < 0.05
Most sample size calculations factor in all four of these inputs. Skipping any of them produces a test that is either underpowered (misses real effects) or oversized (wastes time and traffic).
The math itself usually involves a z-test or a two-proportion t-test, comparing conversion rates between the two groups. You do not need to run these by hand. A solid ab test calculator handles the computation instantly. What you need to understand is what the inputs mean and why each one matters.
Pro Tip: Set your MDE before you launch, not after. If you decide after seeing results that a 0.5% lift "counts," you are unconsciously letting the data guide your criteria. That defeats the purpose of hypothesis testing entirely.
Common mistakes in interpreting A/B test results
Even analysts with strong fundamentals stumble here. The statistical mechanics of an ab significance test are well-documented, but the behavioral traps are harder to avoid.
-
Peeking and stopping early. This is the single most prevalent mistake. Stopping a test the moment it crosses the p < 0.05 threshold inflates false positives because early peeking causes misleading significance results. Traffic patterns vary by day of week, and stopping mid-cycle often catches a fluke.
-
Ignoring confidence intervals. A p-value tells you whether an effect exists. A confidence interval tells you how large it might actually be. A result showing a 2% lift with a 95% confidence interval of +0.1% to +3.9% is quite different from one showing a 2% lift between +1.8% and +2.2%. The first is much less certain in practice.
-
Confusing statistical with business significance. A statistically significant result does not equal business impact. A 0.1% improvement in conversion rate could clear any significance threshold on a large enough sample while still not justifying the developer time to ship the change.
-
Running underpowered tests. If your site gets 500 sessions per week and you test for five days, you will almost never have enough data to detect a real effect unless the change is massive. Small samples produce noisy results that swing wildly.
-
Multiple testing without correction. Testing five variants simultaneously is not the same as testing one. Multiple comparisons inflate Type I error, meaning you will find "significant" results by accident. Applying a Bonferroni correction or similar adjustment helps, but it also reduces statistical power.
"Statistical significance is essential to ensure differences aren't due to random chance, but it must be balanced with practical business context to avoid wasted effort." — A/B Test Significance Calculator | Pearson
The fix for most of these mistakes is planning your test before you launch it, not auditing it while it runs.
Designing A/B tests that actually work
Good test design is where reliable results are born. By the time you are looking at a significance readout, most of the important decisions have already been made.
Start with a falsifiable hypothesis
A strong hypothesis names the change, the expected direction, and the reason. "Changing the CTA button from gray to orange will increase clicks because higher contrast improves visibility" is testable. "Let's try a new CTA" is not.
Determine sample size before you start
Proper power and sample size planning is non-negotiable. Use a test significance calculator to determine how many users you need per variant based on your baseline rate, your MDE, your target power (80% is standard), and your confidence level. Then calculate how long that will take given your actual traffic.
Choose your confidence level based on context
| Scenario | Recommended confidence level | Rationale |
|---|---|---|
| Homepage copy change | 90% | Low risk, easy to reverse |
| CTA button redesign | 95% | Standard threshold, moderate risk |
| Pricing page update | 99% | High revenue impact, hard to reverse |
| New checkout flow | 99% | High stakes, irreversible UX shift |
Run full business cycles
Tests must run for at least two full business weeks to capture natural traffic variation across different days. For low-traffic sites (under 1,000 sessions per week), that window extends to four to six weeks. Seasonal effects can also distort results if you run a test during a promotional event or holiday and then try to generalize the findings.

Monitor guardrail metrics
Your primary metric is conversion rate, but track secondary metrics too: bounce rate, time on page, revenue per visitor. A test might boost signups while wrecking engagement. Winning on one metric while losing on another is not a real win.
Pro Tip: Pick one primary metric before launch and treat everything else as guardrails. Changing your success metric mid-test after seeing which metric favors your variant is a form of p-hacking, even if it feels like informed analysis.
Practical significance and industry benchmarks
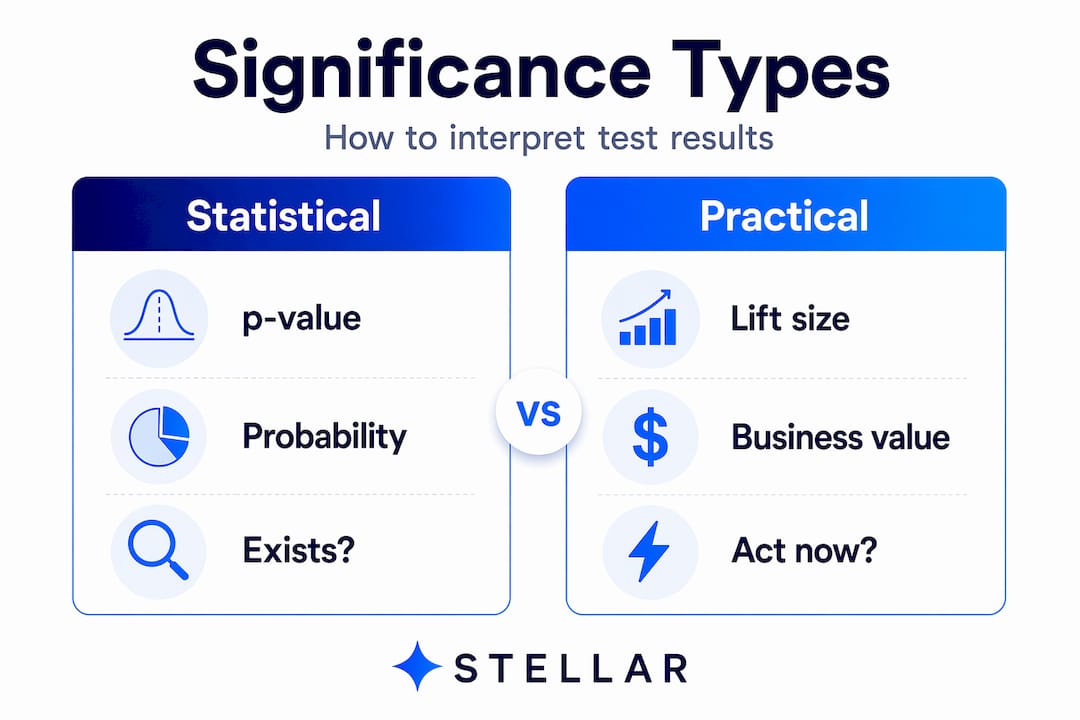
Statistical significance confirms that an effect exists. Practical significance asks whether that effect is worth acting on.
The lift magnitude and confidence intervals together tell a more complete story than a p-value alone. A result showing a statistically significant +0.08% conversion lift might be real, but if you are in an industry where typical conversion improvements run 2 to 10% for B2C e-commerce and 3 to 12% for B2B, a 0.08% gain barely moves the needle.
Here is a benchmark reference for what constitutes a meaningful conversion rate improvement by segment:
| Segment | Typical meaningful lift range |
|---|---|
| B2C e-commerce | 2% to 10% |
| B2B lead generation | 3% to 12% |
| SaaS growth (freemium) | 3% to 8% |
| Content or media sites | 1% to 5% |
Even a statistically significant 0.1% lift may not justify engineering costs when your baseline conversion rate is 1.5% and your average order value is $30. Always run the math on expected revenue impact before shipping a change.
Practical significance also means asking whether the result is stable. A/B test significance means something very different on day 3 versus day 21 of a well-designed test. Combine your p-value with absolute lift, relative lift, and the width of your confidence interval to build a full picture before making a call.
For deeper guidance on connecting significance readings to real business context, the ab test significance guide at Gostellar walks through exactly this kind of applied interpretation.
When standard A/B testing does not fit
Classic frequentist A/B testing assumes you have enough traffic to reach significance within a reasonable time frame. Not every business does.
Bayesian testing frameworks solve a real problem here. Instead of asking "is the p-value below 0.05?", they ask "what is the probability that variant B beats variant A?" That framing is more intuitive and produces actionable probability estimates earlier, without requiring massive sample sizes. For SMEs or niche B2B products with limited monthly traffic, Bayesian methods and directional tests are often the more practical path.
Beyond Bayesian methods, a few other approaches deserve attention:
- Sequential testing: Tests that continuously monitor results and stop only when pre-specified boundaries are crossed. This handles the peeking problem without requiring you to commit to a fixed sample size in advance.
- Adaptive experiment designs: Allocate more traffic to winning variants during the test, reducing the cost of running an underperforming variant for weeks.
- Observational causal inference: When you cannot run a controlled experiment at all, regression discontinuity or difference-in-differences methods can extract causal signals from observational data.
Choosing between frequentist and Bayesian approaches is a genuinely strategic decision, not just a technical one. The Bayesian vs frequentist comparison at Gostellar breaks down which fits which situation clearly.
Pro Tip: If your site gets under 5,000 monthly users, Bayesian testing will give you better decisions faster than waiting to hit 95% frequentist significance on a test that might take six months to complete.
My honest take on A/B significance testing
I've spent years looking at test results across teams of varying sophistication, and the pattern I keep seeing is the same. People treat p < 0.05 like a finishing line when it is really just a filter. You have cleared the floor, not won anything.
What I've found is that the most dangerous tests are not the ones that fail. They are the ones that "succeed" based on a single small lift, get shipped, and then deliver no measurable business improvement because nobody asked whether the effect size actually mattered. I've watched teams celebrate a 0.6% conversion improvement that, when modeled out against actual revenue, added up to less than the cost of the meeting where they decided to run the test.
The other lesson I keep relearning: null results are data. If a well-designed test shows no significant difference, you have learned something real about your users. That is not failure. The teams I respect most treat inconclusive tests as legitimate outcomes and document them the same way they would a win.
The right framing is to treat the a/b significance test as one input in a broader decision process, not the final word. Combine it with effect size, business context, A/B testing best practices, and honest evaluation of your test's quality. That is what separates analysts who build compounding knowledge from ones who just rack up inconclusive wins.
— Juan
Run smarter A/B tests with Gostellar
Understanding significance principles is only half the job. Running tests quickly, cleanly, and without engineering overhead is the other half.

Gostellar is built specifically for marketers and growth teams who want reliable experiment results without complexity. The platform includes real-time analytics that surface significance readings, lift estimates, and confidence intervals as your test runs. Its no-code visual editor means you can launch a test in minutes, and its lightweight 5.4KB script keeps page performance intact throughout. Whether you are testing landing page copy, CTAs, or full layout changes, Gostellar gives you the data clarity to act with confidence. Start testing for free and see how fast reliable results can come in.
FAQ
What is a good p-value for an A/B test?
A p-value below 0.05, corresponding to 95% confidence, is the standard threshold for most A/B tests. For higher-stakes decisions like pricing changes, teams typically require p < 0.01, which equals 99% confidence.
How many visitors do I need for an A/B significance test?
Sample size depends on your baseline conversion rate, minimum detectable effect, power level (usually 80%), and confidence level (usually 95%). Use a test significance calculator before launching to determine the exact number and avoid underpowered tests.
Can a result be statistically significant but not worth acting on?
Yes. Statistical significance only tells you that an effect likely exists. Even a statistically significant tiny lift may not justify the cost of implementation if the absolute improvement in revenue or conversions is negligible.
How long should I run an A/B test?
Run tests for at least two full business weeks to capture day-of-week traffic variation. Sites with under 1,000 sessions per week should extend that to four to six weeks to build a reliable sample.
What is the difference between frequentist and Bayesian A/B testing?
Frequentist testing asks whether a result meets a fixed significance threshold. Bayesian testing estimates the probability that one variant is better than another, which works better for low-traffic sites and gives more intuitive, earlier insights.
Recommended
Published: 5/23/2026