
BI analytics: Meaning, methods, and marketing impact
TL;DR:
- BI analytics provides real-time insights into current marketing performance, not future predictions.
- Effective BI relies on clear metric definitions and well-structured data sources to inform decisions.
- Aligning teams around shared data understanding enhances marketing clarity and accelerates action.
Most marketers assume "analytics" means machine learning predictions or AI-driven forecasts. That assumption sends teams chasing tools they don't need while missing the foundation that actually drives results. Business intelligence (BI) analytics is not about predicting the future. It's about understanding the present and recent past with enough clarity to act fast and act smart. For SMB marketing teams running A/B tests, managing campaign budgets, and trying to prove ROI, BI analytics is the engine that turns scattered data into decisions. This guide cuts through the confusion and shows you exactly how to use it.
Table of Contents
- What is BI analytics? A marketer's plain-English definition
- How BI analytics works: From data sources to dashboards
- Key benefits and benchmarks of BI analytics in marketing
- BI analytics for stronger A/B testing and agile marketing
- What most marketers miss about BI analytics
- Take your marketing analytics further with guided BI tools
- Frequently asked questions
Key Takeaways
| Point | Details |
|---|---|
| BI analytics explained simply | Business intelligence analytics transform raw data into visual reports that show what’s happening in your marketing. |
| Measurable marketing impact | Companies using BI see faster reporting and as much as 40% better test results through quicker experimentation. |
| Dashboard clarity drives decisions | Clear, shared BI dashboards help teams align on metrics and respond faster to real campaign data. |
| Focus on team consistency | The biggest BI gains come from solid processes and team-wide metric understanding, not just advanced tech features. |
What is BI analytics? A marketer's plain-English definition
Let's start with something most definitions get wrong: BI analytics is not the same as "doing analytics." The term has a specific meaning, and understanding it will save you from investing in the wrong tools or expecting the wrong outcomes.
BI (Business Intelligence) is a technology-driven process that transforms raw data into meaningful insights, primarily using descriptive analytics to answer "what happened" and "what is happening now" through reporting, dashboards, and visualization. That word "descriptive" is the key. BI analytics describes reality. It doesn't predict it, and it doesn't tell you what to do about it directly. That's its job, and it does that job extremely well.
Where marketers get tangled up is when they conflate BI with business analytics (BA). They sound almost identical, but the scope is different. According to Gartner's definition, BI analytics often refers to the combination of BI tools with analytics capabilities, but BI focuses on descriptive analytics while business analytics emphasizes predictive and prescriptive analytics to answer "why it happened" and "what will happen next." In short: BI tells you your email open rate dropped 15% last Tuesday. Business analytics tries to tell you why that drop happened and what to do next.
For most SMB marketing teams, the BI layer is where the highest-value work happens. Why? Because you can't predict or prescribe anything useful if your descriptive foundation is broken. Teams that skip ahead to predictive modeling without solid BI in place end up forecasting from bad data.
Here's what BI analytics actually does in a marketing context:
- Reports: Structured summaries of campaign performance across defined time periods (weekly email results, monthly paid ads summaries)
- Dashboards: Live, visual interfaces that pull data from multiple sources and display it in one place
- Data visualizations: Charts, graphs, and heatmaps that make trends immediately obvious to non-technical stakeholders
- Ad hoc queries: On-demand answers to specific marketing questions without waiting for a data team
A practical example: you launch two landing page variants for a paid search campaign. Your BI analytics dashboard shows you, in real time, which variant is getting more clicks, lower bounce rates, and higher form completions. You don't need a data scientist for that. You need a clean dashboard connected to the right sources.
"The goal of BI analytics is not to replace human judgment. It's to give marketers the factual foundation they need to make faster, more confident decisions based on what's actually happening."
If you're newer to this space, a solid marketing analytics guide will help you build the right mental model before you choose tools. And when you're ready to connect platforms, understanding integrating analytics tools for marketing success is where theory becomes practice.
How BI analytics works: From data sources to dashboards
Understanding the definition is one thing. Seeing how the machinery actually runs is what helps marketers use BI analytics confidently, without needing to become a data engineer.

The standard technical process behind most BI platforms follows an ELT pattern. According to Investopedia's BI overview, core BI methodologies include data collection from sources like CRM and marketing platforms, analysis for patterns, reporting, and visualization via dashboards, following an ELT (Extract, Load, Transform) pattern with semantic layers for metric consistency.
Here's what that looks like in plain steps for a marketing team:
- Extract: Raw data is pulled from your marketing sources (Google Ads, your CRM, email platform, website analytics, social media)
- Load: That data is loaded into a central data warehouse or cloud storage system
- Transform: The raw data is cleaned, organized, and structured into a format your BI tool can read and display
- Visualize: The transformed data populates dashboards and reports that your team reviews and acts on
The sources feeding into that process matter enormously. A typical SMB marketing stack might include:
| Data source | What it contributes to BI |
|---|---|
| CRM (e.g., HubSpot, Salesforce) | Lead quality, pipeline velocity, conversion rates |
| Paid ads platforms | Spend, impressions, click-through rates, cost per acquisition |
| Website analytics | Traffic, behavior flow, bounce rates, session duration |
| Email platforms | Open rates, click rates, unsubscribe trends |
| A/B testing tools | Variant performance, statistical significance, goal completion |
Now, here's where many BI setups fail: the semantic layer. A semantic layer is a translation interface that sits between your raw data and your dashboard. It defines what "conversion" means, what counts as an "active user," and how revenue is calculated. Without it, your sales team and your marketing team might both run reports on "leads" and get completely different numbers because they're each pulling from different definitions.
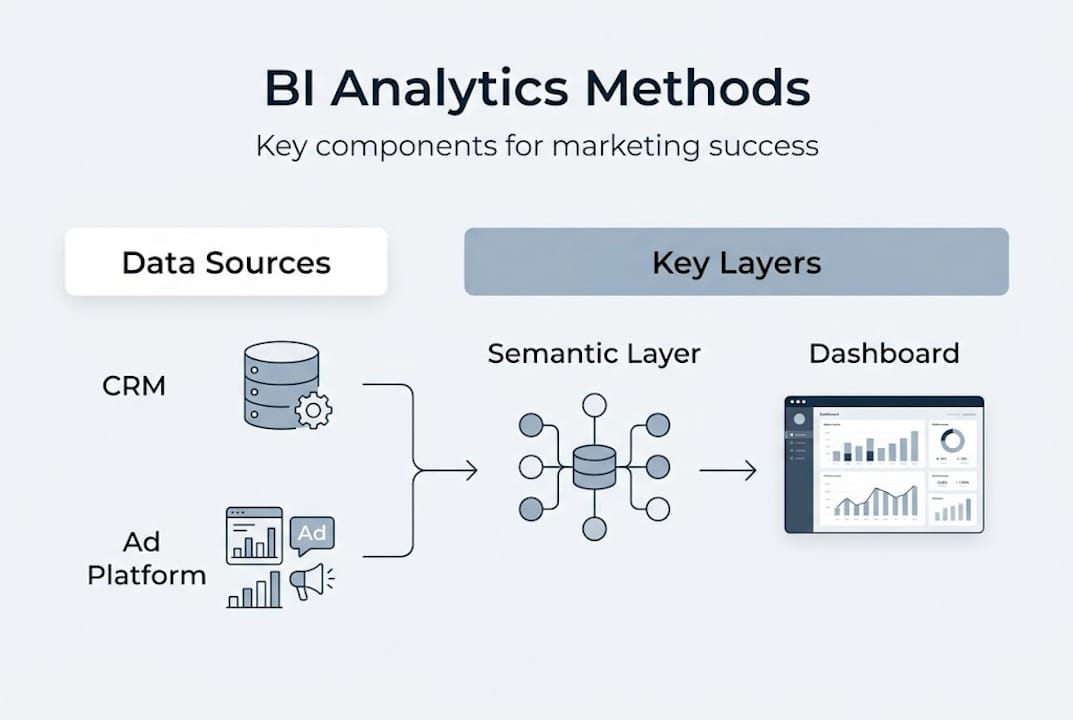
Pro Tip: Before rolling out any BI dashboard to your marketing team, document your metric definitions first. What counts as a conversion in your context? What qualifies as a "qualified lead"? Lock those definitions into the semantic layer so every report tells the same story. This single step eliminates more internal confusion than any new tool ever will.
For a practical starting point on reading and interpreting what BI surfaces, see this analytics dashboards overview and then learn how to analyze test results in a marketing context.
Key benefits and benchmarks of BI analytics in marketing
Knowing how BI analytics works is useful. Knowing what it actually delivers for businesses like yours is what gets teams to prioritize it.
Let's look at real numbers. Business intelligence benchmarks show that the average firm uses 3.8 BI products, with 26% global adoption, while testing programs running 8 to 12 tests per month achieve 25 to 40% cumulative marketing lift. And European Wax Center, a mid-market brand, reduced reporting time by 90% after implementing a BI solution. That's not a rounding error. That's dozens of hours reclaimed every month that can go back into campaign work.
For SMB marketers, the top three measurable benefits of BI analytics are:
- Faster reporting cycles: Automated dashboards replace manually assembled spreadsheets, cutting weekly reporting from hours to minutes
- Better campaign allocation: When you can see which channels are actually converting (not just generating traffic), budget decisions become obvious rather than political
- Tighter A/B testing loops: Real-time data access means you're not waiting days to know if a variant is underperforming. You see it early and act early
Compare the experience of traditional reporting versus BI-empowered campaigns:
| Factor | Traditional reporting | BI-powered campaigns |
|---|---|---|
| Reporting frequency | Weekly or monthly | Daily or real-time |
| Time to prepare report | 3 to 5+ hours | Automated |
| Data sources combined | Usually 1 to 2 | 5 to 10+ |
| Decision speed | Days | Hours |
| Error risk | High (manual entry) | Low (automated feeds) |
| Cross-team alignment | Often misaligned | Shared definitions via semantic layer |
The shift from traditional to BI-powered is not just about speed. It's about confidence. When your marketing director asks "how did the campaign perform last week?" you want to answer with a link to a live dashboard, not a request for three more days to compile the data.
For more on turning data into action, the data-driven marketing approach is worth building into your team's workflow. And if you're specifically scaling an SMB operation, small business analytics resources can help you right-size your BI setup without overbuilding.
BI analytics for stronger A/B testing and agile marketing
This is where BI analytics moves from interesting to essential for most marketing teams. A/B testing without reliable, timely data is just guessing with extra steps.
Here's how to use BI analytics to run tighter, faster experiments:
- Define your success metric before you test: Use your BI dashboard to establish a baseline. What's your current conversion rate, average session duration, or click-through rate? You can't measure improvement without a starting point.
- Connect your testing tool to your BI data layer: When your A/B testing platform feeds results directly into your dashboard, you see variant performance alongside all your other campaign data, not in isolation.
- Set a minimum sample size and check it in your dashboard: Don't call tests early. BI dashboards with built-in goal tracking let you monitor when you've hit statistical significance thresholds.
- Review results in context: A variant might win on click-through rate but lose on downstream conversion. BI analytics lets you see the full picture rather than optimizing for a surface metric.
- Document findings and iterate: Your BI system becomes your experiment log. Over time, patterns emerge about what works for your audience, and those patterns are far more valuable than any single test result.
That said, BI analytics has real limits worth knowing. As dbt's guide on BI outlines, BI struggles with unstructured data, real-time streaming without proper setup, and requires data quality testing and semantic layers to avoid metric inconsistencies. AI can enhance BI outputs, but it needs proper context to do so usefully.
The most common pitfalls in using BI for A/B testing include:
- Data delay: If your pipeline isn't set up for near-real-time updates, you're making decisions on stale data. Confirm your data refresh rate before you trust your dashboard for live testing.
- Metric ambiguity: Running a test where "conversion" means different things in your testing tool versus your BI dashboard creates false positives. Align definitions before you launch.
- Overreacting to early data: BI makes data visible early, which is powerful. But it also tempts teams to call tests too soon. Build a minimum observation window into your testing protocol.
Pro Tip: When setting up your BI dashboard for A/B testing, create a separate view specifically for experiments. Include the variant name, sample size, your primary metric, your secondary metric, and the statistical confidence level side by side. This single view eliminates 80% of the "which variant won?" debates.
For teams ready to act on this, real-time A/B analytics is the deeper resource, and comparing top beta testing tools for SMBs will help you match your BI setup to the right testing platform.
What most marketers miss about BI analytics
Here's the uncomfortable truth: most marketing teams don't have a data problem. They have a clarity problem.
We see teams invest in sophisticated analytics stacks, AI-powered attribution tools, and predictive dashboards. Then they still argue in meetings about which numbers are right. Why? Because no one aligned on what the numbers mean before the tools went live. The technology isn't the bottleneck. The shared understanding is.
The teams we've seen get the most value from BI analytics are not the ones with the most advanced tech. They're the ones where everyone, from the CMO to the campaign coordinator, looks at the same dashboard and agrees on what it's measuring. That alignment sounds basic. It is basic. But it's shockingly rare.
The instinct to chase AI features and predictive models is understandable. But if your current reporting is inconsistent or your metric definitions vary by team member, predictive analytics will just amplify that confusion. Fix the foundation first. Get your choosing analytics tools decision right by asking "does this make our current data clearer?" before asking "does this predict the future?"
Clarity, consistency, and speed of action beat sophistication every time in an SMB marketing environment.
Take your marketing analytics further with guided BI tools
You now have a clear picture of what BI analytics does, how it operates, and where it creates real lift for marketing teams. The next step is applying that understanding with a tool built for how SMB marketers actually work.

Stellar is designed for exactly this moment. Whether you're setting up your first A/B test or refining a multi-variant campaign, Stellar's real-time analytics dashboard gives you the BI foundation you need without complex setup or a dedicated data team. With a lightweight 5.4KB script, no-code visual editor, and advanced goal tracking built in, you get the descriptive insights that power smart decisions from day one. There's a free plan for businesses under 25,000 monthly tracked users. See how it fits your workflow at gostellar.app.
Frequently asked questions
What is the difference between BI analytics and business analytics?
BI analytics focuses on descriptive analytics, answering what happened and what is happening right now, while business analytics goes further to predict and prescribe what will happen next using more advanced modeling techniques.
How do BI analytics help with marketing A/B testing?
BI analytics gives you a clean, real-time view of test performance alongside your broader campaign data, making it easier to spot trends and act quickly. Testing programs running 8 to 12 tests per month achieve 25 to 40% cumulative marketing lift.
What are semantic layers in BI analytics?
Semantic layers ensure metric consistency across all reports and dashboards by defining key terms like "conversion" or "active user" in one central place, so every team member is looking at the same version of the truth.
What types of data can BI analytics handle, and what are its limits?
BI analytics works best with structured, organized data from sources like CRMs and ad platforms. As noted by dbt's BI research, it can struggle with unstructured data or real-time streaming if the pipeline isn't configured correctly.
What are some real business outcomes achieved with BI analytics?
European Wax Center reduced reporting time by 90% using BI tools, and marketing teams running consistent testing programs backed by BI data see cumulative performance increases of up to 40% over time.
Recommended
Published: 4/26/2026