
Boost App User Experience with A/B Testing
TL;DR:
- 25% of apps are abandoned after one use, often due to onboarding and performance issues.
- A/B testing and real-time analytics enable low-risk, targeted UX improvements with measurable results.
- Small, focused tests on onboarding and push notifications can significantly boost retention and engagement.
25% of apps are abandoned after just one use. That number stings, especially when you've invested months building something users open once and never return to. The instinct for most marketing and product teams is to blame the design and call for a full redesign. But massive overhauls are expensive, risky, and slow. The good news? You don't need a big relaunch to move the needle on app user experience. A/B testing paired with real-time analytics gives SMBs a disciplined, low-risk path to meaningful UX improvements. This guide walks you through the metrics that matter, the testing process that works, and the tools that fit a lean budget.
Table of Contents
- Why app user experience matters: Key metrics and real-world impact
- The essentials of A/B testing for better app user experience
- Leveraging real-time analytics to make smarter UX decisions
- Avoiding A/B testing pitfalls: Edge cases, platform nuances, and robust results
- What most marketers miss about app user experience improvements
- Unlock better app UX with smarter tools
- Frequently asked questions
Key Takeaways
| Point | Details |
|---|---|
| Focus on key metrics | Day 1 and Day 30 retention rates reveal if your app UX keeps users engaged. |
| Test changes methodically | A/B testing one change at a time for 2-3 weeks delivers stronger, safer results. |
| Real-time analytics matter | Heatmaps, funnels, and session replays help you spot and fix UX roadblocks fast. |
| Avoid common biases | Run tests on each platform, control test duration, and use inconclusive results to improve your next iteration. |
Why app user experience matters: Key metrics and real-world impact
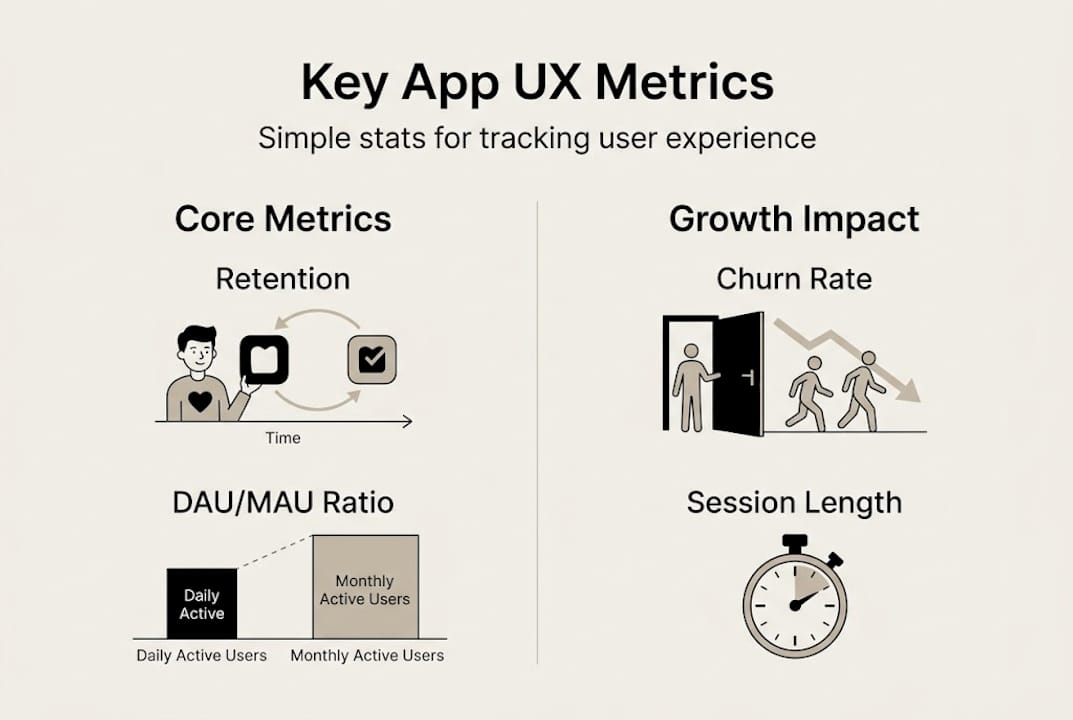
Retention is the scoreboard of app UX. If users aren't coming back, every other metric is noise. Before you can fix anything, you need to know which numbers tell the real story.
The four core metrics every SMB should track are retention rate, DAU/MAU ratio (daily active users divided by monthly active users), session engagement, and abandonment rate. Retention tells you if users find ongoing value. The DAU/MAU ratio, sometimes called the "stickiness" ratio, shows how habitual your app use is. Engagement measures what users actually do inside the app. Abandonment pinpoints where they stop.
Here's what the data looks like across app categories:
| App category | Day 1 retention | Day 30 retention | Platform edge |
|---|---|---|---|
| Gaming | ~35% | ~8% | iOS leads Android |
| Productivity | ~28% | ~6% | iOS leads Android |
| E-commerce | ~22% | ~4% | iOS leads Android |
| Health & fitness | ~20% | ~4% | iOS leads Android |
| Global average | 25.3% | 5.7% | iOS is 46% higher |
Most users who leave, leave fast. The most common reasons include:
- Confusing onboarding that requires too many steps before showing value
- Slow load times or crashes on first open
- Too many permissions requested upfront
- Generic push notifications that feel irrelevant
- Poor discoverability of core features
"25% of apps are abandoned after the first use." The apps that survive that first session aren't necessarily more feature-rich. They're more intentional about the first few minutes of experience.
The upside of fixing these friction points is real. Push notifications can boost app retention by 3 to 10 times when personalized correctly. That's not a marginal gain. For a business with 10,000 monthly active users, a 10x improvement in retention from a single notification strategy change is transformational.
App UX improvements connect directly to business outcomes: lower customer acquisition cost, higher lifetime value, more in-app conversions, and better review scores. The UX optimization guide breaks down how these elements connect across the funnel. And when you pair UX data with optimization tips built for growth marketers, you can prioritize where effort pays off fastest.
The essentials of A/B testing for better app user experience
A/B testing isn't guessing. It's structured experimentation where you expose different user segments to different versions of an experience, then measure which performs better. For app UX, that could mean testing two onboarding flows, two button colors, or two push notification copy variations.
Here's the process that holds up in practice:
- Identify the friction point using analytics. Where are users dropping off? High abandonment on step three of onboarding is a signal, not a verdict.
- Form a hypothesis using the PIE framework. PIE stands for Potential (how much improvement is possible?), Importance (how much traffic does this area get?), and Ease (how hard is this to implement?). Prioritized PIE hypotheses help you focus resources on tests with the best expected return.
- Implement with feature flags or server-side testing. This lets you control which users see which variant without pushing multiple app versions.
- Run the test for at least two weeks. Shorter tests catch novelty effects, not real behavior shifts.
- Analyze for 95% statistical significance before declaring a winner. Anything below that threshold is too noisy to act on.
Should you run A/B tests or multivariate tests? Here's a quick comparison:
| Factor | A/B testing | Multivariate testing |
|---|---|---|
| Complexity | Low | High |
| Traffic needed | Moderate | Large |
| Best for SMBs | Yes | Rarely |
| Time to results | 2-3 weeks | 4-8 weeks |
| Variable isolation | Strong | Weaker |
For most SMBs, A/B testing is the right default. Multivariate tests require significantly more traffic and time to reach significance, which makes them impractical for smaller apps.
Pro Tip: Only change one variable per test. If you redesign the onboarding screen AND change the CTA text at the same time, you won't know which change drove the result.
Common pitfalls include running tests too short, peeking at results early, and stopping a test the moment one variant pulls ahead. You can find a deeper breakdown of A/B test strategies designed for app marketers, as well as guidance on validating A/B test ideas before you commit resources. For the foundational rules, reviewing A/B testing best practices will save you from the most expensive mistakes.
Leveraging real-time analytics to make smarter UX decisions
A/B testing tells you which experience wins. Real-time analytics tell you why users behaved the way they did. Together, they close the feedback loop that turns guesses into decisions.
Here are the analytics methods that matter most for app UX:
- Funnel analysis: Shows exactly where users exit a multi-step flow, like checkout or onboarding
- Heatmaps: Visualize where users tap, scroll, or ignore in your interface
- Session recordings: Let you watch real user sessions to catch friction that numbers alone miss
- Real-time drop-off tracking: Alerts you immediately when a new release causes unexpected exits
- DAU/MAU trending: Tracks whether your changes are building habit or just spiking novelty
Session recordings, heatmaps, and funnels are the most actionable real-time analytics methods for in-app UX. Top tools for SMBs include Mixpanel, Heap, Amplitude, and Pendo, each with free or low-cost tiers suited to lean teams.

| Tool | Best for | Free tier | Key strength |
|---|---|---|---|
| Mixpanel | Event tracking & funnels | Yes (limited) | Granular event data |
| Heap | Automatic event capture | Yes (limited) | Zero-setup tracking |
| Amplitude | Retention & cohort analysis | Yes | Retention dashboards |
| Pendo | In-app guides + analytics | No (trial only) | Contextual guidance |
Pro Tip: Don't try to instrument every feature at launch. Start with the highest-traffic flows, your onboarding sequence and your core action, then expand coverage as your team grows comfortable with the data.
Real-time monitoring is especially powerful right after a new release. Instead of waiting for weekly reports, you can spot a spike in drop-offs within hours and roll back or iterate fast. The user journey optimization framework helps you map which journeys deserve the most analytical attention first.
Avoiding A/B testing pitfalls: Edge cases, platform nuances, and robust results
Good intentions and bad test design produce useless data. Here are the five biggest mistakes that undermine A/B test reliability in app UX work:
- Running tests too short. A 3-day test picks up weekend behavior, not weekly patterns. Tests need 2-plus weeks to account for full user cycles.
- Using sample sizes that are too small. Fewer than a few hundred conversions per variant makes significance calculations unreliable.
- Changing the test mid-run. Adjusting copy, targeting, or UI during a live test contaminates results. Commit to the original design and let it run.
- Combining iOS and Android into one test. Platform behavior, OS-level differences, and crash patterns differ enough that mixed-platform tests produce misleading averages.
- Discarding inconclusive results. A test that shows no significant difference is still useful data.
Inconclusive results aren't failed tests. They drive your next hypothesis and prevent you from shipping a change that would have made no difference.
Beyond these five, pay attention to weekday and weekend usage patterns. Apps that skew toward weekend use will show false positives if a test runs only Monday through Friday. Monitor for crash rate changes during the test window, since a variant that converts better but crashes more often is not a winner.
For platform-specific nuances, test call-to-action buttons separately on iOS and Android because tap target expectations and visual conventions differ. When choosing user testing apps to support your experiments, look for platforms that allow segment-level filtering by OS, device type, and user tenure.
A robust test checklist includes: defined primary metric before launch, minimum sample size calculated upfront, fixed test duration, no mid-test changes, and platform-specific reporting.
What most marketers miss about app user experience improvements
Here's the uncomfortable truth: most marketing teams spend months planning a full redesign that delivers less retention lift than a two-week A/B test on onboarding copy. The obsession with big launches is understandable. They feel significant. They're easier to pitch internally. But the data rarely backs them up.
Simplified onboarding drives up to 20% retention gains. Personalized notifications produce up to 40% higher open rates. These aren't from massive product overhauls. They're from targeted, measurable tests run in weeks, not quarters.
The SMBs winning at app UX right now aren't outspending their competitors. They're out-testing them. They pick the highest-impact flows: onboarding, the first core action, and push notification strategy, and they iterate relentlessly using data. They treat every test result, winner or not, as a signal.
Pro Tip: Before touching anything else in your app, run one focused test on your onboarding flow. It's where expert UX tips consistently show the highest return on experimentation effort.
The biggest mindset shift is accepting that small changes compound. A 5% lift in Day 1 retention, followed by a 5% improvement in notification open rates, followed by a 5% reduction in step-three onboarding abandonment adds up to a fundamentally different retention curve over 90 days.
Unlock better app UX with smarter tools
Putting A/B testing and real-time analytics into practice doesn't require a large engineering team or an enterprise budget. What it requires is the right infrastructure and a commitment to letting data lead.

Stellar is built for exactly this. Our platform gives marketers and product managers a no-code visual editor, real-time analytics, and advanced goal tracking in a lightweight 5.4KB script that won't slow down your app. You can run your first experiment without writing a line of code. Explore GoStellar's full toolkit to see how it fits your team's workflow. Or dive straight into A/B testing strategies built specifically for app marketers who want results without complexity.
Frequently asked questions
What is the most important app UX metric for SMBs to track?
Day 1 and Day 30 retention rates are the clearest indicators of long-term app health. Day 1 averages 25.3% and Day 30 drops to 5.7% globally, making early retention your most actionable target.
How long should a mobile app A/B test run for reliable results?
Run tests for at least two full weeks to capture real behavioral patterns across different days and user types. Reaching 95% statistical significance before calling a winner is non-negotiable.
What are the best affordable tools for real-time app analytics?
Mixpanel, Heap, Amplitude, and Pendo are the leading options for SMBs. Top tools like these offer free or low-cost tiers with enough depth for most lean product teams.
What is the PIE framework for A/B testing?
PIE stands for Potential, Importance, and Ease. It's a scoring method used to prioritize test hypotheses so you run experiments where the expected impact is highest relative to effort.
Why should iOS and Android tests be run separately?
Platform differences in behavior, performance, and UI conventions mean that combining both into one test produces averages that don't reflect either audience accurately. Testing platforms separately ensures your results are clean and your rollout decisions are platform-specific.
Recommended
Published: 4/17/2026