
Ecommerce conversion rate benchmarks and tips for 2026
TL;DR:
- Ecommerce conversion rates vary by device, industry, and traffic source, with no universal standard.
- Improving conversion involves UX, trust signals, offer quality, and mobile-specific optimizations.
- Focus on your own data, continuous testing, and using specialized tools rather than comparing to competitors.
Most ecommerce marketers treat conversion rate like a report card grade, obsessing over whether their number is "good" or "bad" compared to some vague industry standard. The problem is that a universal benchmark doesn't exist. Your conversion rate is shaped by your traffic sources, product category, device mix, and dozens of other variables unique to your store. This article breaks down the latest data on what ecommerce conversion rates actually look like across devices and industries, explains the factors that push them up or down, and gives you a practical roadmap for improvement that's grounded in your specific situation.
Table of Contents
- Defining ecommerce conversion rate and why it matters
- Industry benchmarks: What is a 'good' ecommerce conversion rate?
- What influences ecommerce conversion rates?
- How to improve your ecommerce conversion rate: Practical steps
- Why chasing competitor conversion rates is overrated
- Take your conversion rate to the next level with specialized tools
- Frequently asked questions
Key Takeaways
| Point | Details |
|---|---|
| No universal 'good' rate | A good ecommerce conversion rate depends on your niche, device, and audience. |
| Benchmarks inform, not dictate | Industry averages help you gauge performance but shouldn’t be your only target. |
| Continuous testing is vital | Regular A/B testing and analysis are key to steadily improving conversion rates. |
| Optimize for all devices | Desktop, mobile, and tablet users behave differently and need unique strategies. |
Defining ecommerce conversion rate and why it matters
Before you can improve a number, you need to understand exactly what it measures. Your ecommerce conversion rate is calculated with a simple formula:
Conversion rate = (Number of sales / Number of visitors) x 100
So if 3,000 people visit your store and 75 of them complete a purchase, your conversion rate is 2.5%. Simple in theory, but the nuance comes from deciding what counts as a "conversion" in the first place.
Not every conversion is a purchase. Depending on your business goals, a conversion could be:
- A completed product purchase
- A newsletter or email list sign-up
- An account registration
- Adding a product to a wishlist
- Clicking a "get a quote" button
Most ecommerce teams track purchase conversion rate as their primary metric, but layering in micro-conversions like add-to-cart rate or checkout initiation gives you a richer picture of where shoppers are dropping off. This matters because a low purchase conversion rate doesn't always mean your offers are weak. It might mean your checkout flow is broken, or your cart abandonment emails aren't working.
Understanding tracking ecommerce conversions at multiple funnel stages is what separates stores that guess from stores that grow with intention.
One factor that trips up many small store owners is device variation. Conversion rates differ by device and can meaningfully influence your overall performance benchmarks. A store with heavy mobile traffic will naturally show a lower blended conversion rate than a competitor with a predominantly desktop audience, even if both stores are performing well for their respective channels.
"If you're measuring only your blended conversion rate without splitting it by device, you're flying blind. A single number hides the real story."
This device-level thinking directly informs A/B testing strategy. When you know your mobile rate is dragging down your overall number, you can prioritize mobile-specific tests first, like simplifying your checkout form or improving tap target sizes, rather than wasting resources on desktop redesigns that won't move the needle where it counts most.
Industry benchmarks: What is a 'good' ecommerce conversion rate?
Here's the honest answer: there is no single "good" ecommerce conversion rate. But that doesn't mean benchmarks are useless. They give you a baseline for realistic goal-setting and help you recognize when something is seriously off.
Global ecommerce conversion rate by device (December 2024)
| Device | Conversion rate |
|---|---|
| Desktop | 2.6% |
| Mobile | 2.3% |
| Tablet | 2.9% |
| Overall average | 2.4% |
According to Statista's device-level data, desktop conversion sits at 2.6%, mobile at 2.3%, tablet at 2.9%, and the blended average lands at 2.4%. Tablets edge out desktop, likely because tablet users tend to be more deliberate browsers rather than quick mobile scrollers.
What these numbers actually mean for your store
If your store's overall conversion rate is 1.2%, that's not automatically a crisis. If you're in the luxury jewelry space, 1.5% might be exceptional. If you're selling low-cost impulse products, 4% or higher is achievable. The category you operate in sets a different ceiling entirely.
Here's a rough picture of how niches vary:
- Fashion and apparel: Typically 1.5% to 3%, with lots of browsing before buying
- Electronics: Often 1% to 2%, because purchases are high-consideration and comparison-heavy
- Food and beverage subscriptions: Can reach 3% to 5%, especially with strong repeat-purchase dynamics
- Health and beauty: Around 2% to 4%, driven by personal care routines and loyalty
Traffic source also shifts benchmarks dramatically. Email list traffic commonly converts at 3x the rate of cold paid social traffic. If your paid social campaigns are dragging your blended rate below 2%, that's expected behavior, not a sign of a broken store.
Key stat: The global ecommerce average sits around 2.4%, but the range between the bottom 25% of stores and the top 25% is enormous.
This is why chasing a competitor's reported conversion rate is rarely productive. You don't know their traffic mix, their average order value, or whether they're counting micro-conversions in that number. Focus on proven conversion rate tactics that move your specific metrics, not someone else's.
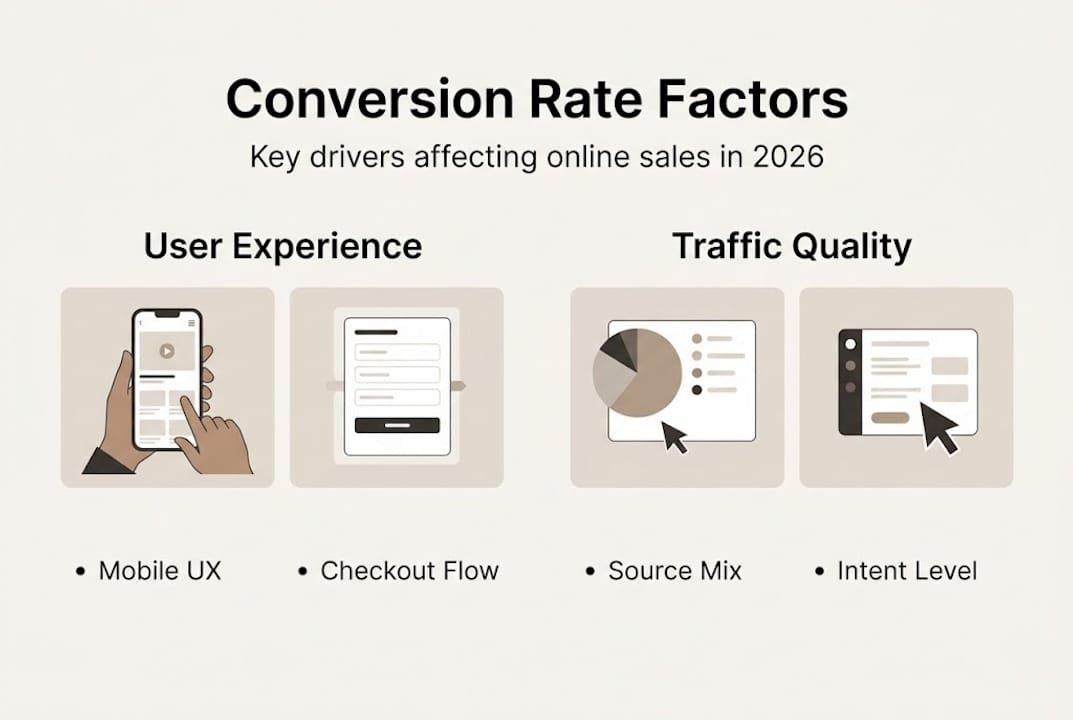
What influences ecommerce conversion rates?
Knowing the benchmarks is useful. Understanding why your rate sits where it does is what actually creates change. Several interconnected factors shape whether a visitor becomes a buyer.
The main drivers at a glance
- User experience (UX): Confusing navigation, slow load times, and poor mobile layouts kill conversions before a shopper even sees your product
- Trust signals: Reviews, security badges, clear return policies, and recognizable payment methods reduce purchase anxiety
- Offer quality: Pricing, value perception, and promotions determine whether the deal feels worth it
- Traffic source quality: Organic search visitors often convert better than cold paid traffic because they have higher intent
- Device type: As shown in the data above, device choice directly affects purchase likelihood
Mobile vs. desktop: The ongoing gap
Mobile conversion rates are typically lower than desktop, and this gap persists for several reasons. Mobile users are often browsing on the go, easily distracted, and less likely to complete a purchase in one session. Small screens make reading product details harder. Typing in payment information is more friction-filled. Checkout forms designed for desktop keyboards become frustrating on a phone touchscreen.

| Factor | Mobile challenge | Desktop advantage |
|---|---|---|
| Screen size | Limited product detail visibility | Full layout, easy comparison |
| Input method | Touch typing errors, friction | Keyboard and mouse precision |
| Session intent | Browsing, research mode | Higher purchase intent |
| Checkout ease | More steps feel overwhelming | Forms feel faster to complete |
Common conversion killers worth auditing now
- Checkout processes requiring account creation before purchase
- Page load times exceeding three seconds
- Unclear or buried return and refund policies
- Limited payment options (no PayPal, Apple Pay, or buy-now-pay-later)
- Product images that don't zoom or show multiple angles
Investing in UX optimization for conversion is one of the highest-return activities you can prioritize, because even small friction reductions compound across thousands of sessions. Similarly, testing speed-focused conversion techniques can deliver quick wins without requiring a full site overhaul.
Pro Tip: Run a five-second test on your homepage and product page with real users. If they can't identify your core offer and a clear next step within five seconds, you have a UX problem worth fixing before any other optimization.
How to improve your ecommerce conversion rate: Practical steps
Understanding what shapes your conversion rate is half the battle. The other half is building a systematic improvement process that you run consistently, not just when results dip.
Here's a step-by-step framework that works for small and mid-sized ecommerce teams:
-
Establish your baseline by device and channel. Pull your conversion rate separately for desktop, mobile, and tablet. Then break it down by traffic source: organic, paid, email, and social. This segmentation reveals where the real problems live, not just what the blended number hides.
-
Compare to relevant benchmarks for your niche. Use the global averages as a floor, then look for industry-specific data for your category. If you're 30% below the average for your product type, that's a signal. If you're tracking close to average on desktop but far below on mobile, that's your priority.
-
Run structured A/B tests on your highest-traffic pages. Start with pages that get enough traffic to produce statistically significant results: your homepage, top product pages, and your checkout funnel. Test one element at a time. Common high-impact tests include changing your primary CTA button color and copy, rewriting your product headlines to focus on benefits rather than features, simplifying your checkout from multiple steps to a single page, and adding or repositioning social proof like star ratings or review counts.
-
Optimize your mobile checkout specifically. Mobile shoppers abandon carts at significantly higher rates than desktop users. Enable autofill, reduce required form fields, offer guest checkout, and integrate payment methods like Apple Pay or Google Pay that eliminate manual entry entirely.
-
Use real-time analytics to measure test results and iterate. Don't run a test for two days and call it. Let tests run until you have statistical confidence, typically 95% or above, before making permanent changes. Then roll out winners and start the next test immediately.
-
Revisit and re-test quarterly. Consumer behavior changes, your product catalog evolves, and seasonality affects performance. A checkout flow that worked perfectly in January might need adjustment by peak holiday season. Knowing device-specific rates, setting clear goals, and continuously testing is what separates growing stores from stagnant ones.
You'll find that strategies to increase conversion often stack on each other. A faster page load improves mobile UX, which lifts mobile conversion, which improves your blended rate, which makes your paid campaigns more profitable. One well-executed test can create a positive chain reaction across your funnel.
Pro Tip: Prioritize your checkout flow tests before anything else. Cart abandonment rates typically hover around 70%, which means most of your conversion opportunity is already inside your funnel, not at the top of it. Fix leaks before you pour in more traffic. See what ecommerce website testing looks like in practice to build your testing calendar.
Why chasing competitor conversion rates is overrated
The ecommerce industry loves publishing benchmark reports, and marketers love comparing themselves to those numbers. We get it. Benchmarks create a simple scoreboard. But this habit causes real harm when taken too far.
Competitor conversion data is almost never apples-to-apples. A competitor reporting a 4% conversion rate might be measuring add-to-cart as a conversion. Their traffic might be 80% email subscribers who already trust them deeply. Their average order value might be a quarter of yours, making impulse purchases far more common.
More importantly, their number tells you nothing about what you should do next. Even if you knew with certainty that a competitor converts at 3.2% and you convert at 2.1%, what would you actually change? The gap doesn't give you an action plan. Your own data does.
The smarter approach is to treat your historical performance as your primary benchmark. Did this month beat last month? Did this A/B test lift conversion by 0.3%? Those are the numbers that compound into real revenue gains over time. Exploring conversion rate optimization approaches that focus on your specific audience and funnel will always outperform generic tactics borrowed from a competitor playbook. Progress built on your own data is durable. Progress borrowed from someone else's context is fragile.
Take your conversion rate to the next level with specialized tools
Analyzing conversion rates and running A/B tests manually is possible, but it's slow and error-prone without the right infrastructure behind it.

Stellar is built specifically for ecommerce marketers and growth-focused teams who want to test and optimize without needing a developer on standby. With a no-code visual editor, advanced goal tracking, and real-time analytics, you can set up experiments on your landing pages, checkout flows, and product pages in minutes. Stellar's lightweight 5.4KB script means your tests won't slow down your site, which matters because page speed is itself a conversion factor. Whether you're just getting started or scaling up your testing program, GoStellar optimization tools offer flexible plans including a free tier for stores with under 25,000 monthly tracked users.
Frequently asked questions
What is considered a good ecommerce conversion rate in 2026?
A typical ecommerce rate sits around 2.4% on average, but what's considered "good" depends heavily on your industry, device mix, and the quality of your traffic sources.
Why is my store's mobile conversion rate lower than desktop?
Mobile conversion rates average around 2.3% compared to desktop's 2.6% because mobile users face more friction: smaller screens, on-the-go browsing behavior, and less streamlined checkout experiences.
How often should I test or optimize my ecommerce site for better conversion rates?
Testing should be a continuous process, not a one-time project. Revisit major site areas and funnel stages at least every quarter to account for seasonal shifts and evolving customer behavior.
Does a higher traffic volume always mean a higher conversion rate?
No. Traffic quality matters far more than volume. A smaller audience of high-intent visitors from email or organic search will almost always out-convert a large wave of cold paid social traffic.
What is the formula for calculating ecommerce conversion rate?
Divide your total number of completed sales by your total number of visitors, then multiply by 100. The result is your conversion rate expressed as a percentage.
Recommended
Published: 4/26/2026