
Heatmaps vs A/B Testing: Boosting Conversion Rates
More than 60 percent of American marketers say user experience research directly drives business growth. For small businesses and global teams aiming to improve conversion rates, heatmaps and A/B testing offer low-barrier entry points to actionable insights. Balancing qualitative and quantitative data helps marketers with limited technical expertise find smarter, faster ways to refine their websites. This guide simplifies the key differences and powerful benefits of heatmaps and A/B testing with practical advice for real results.
Table of Contents
- Defining Heatmaps And A/B Testing
- Key Features And Data Visualization Methods
- Real-World Use Cases For Marketers
- Strengths And Limitations Of Each Approach
- How To Combine Both For Maximum Results
Key Takeaways
| Point | Details |
|---|---|
| Heatmaps provide visual insights | Use heatmaps to visually represent user interactions, identifying engagement hotspots and areas needing improvement. |
| A/B testing delivers quantitative data | Implement A/B testing to statistically validate design variations and measure their impact on performance metrics. |
| Combine both for enhanced optimization | Leverage heatmaps to generate hypotheses and A/B tests to confirm the effectiveness of proposed changes for better user experiences. |
| Focus on high-traffic pages | Begin A/B testing on high-traffic pages and target one variable at a time to obtain clear, actionable insights. |
Defining Heatmaps and A/B Testing
Web optimization strategies rely on two powerful analytical tools: heatmaps and A/B testing. While they might seem similar at first glance, they serve distinct purposes in understanding user behavior and improving digital experiences. A/B testing represents a controlled experiment that compares two variations to measure specific performance metrics, enabling data-driven decision making for websites and digital products.
Heatmaps are visual data representations that use color gradients to illustrate user interaction intensity across digital interfaces. These graphical tools help designers understand behavior patterns by mapping where users click, scroll, and engage most frequently. Unlike traditional analytics that provide numerical data, heatmaps transform complex user interactions into intuitive, color-coded visualizations.
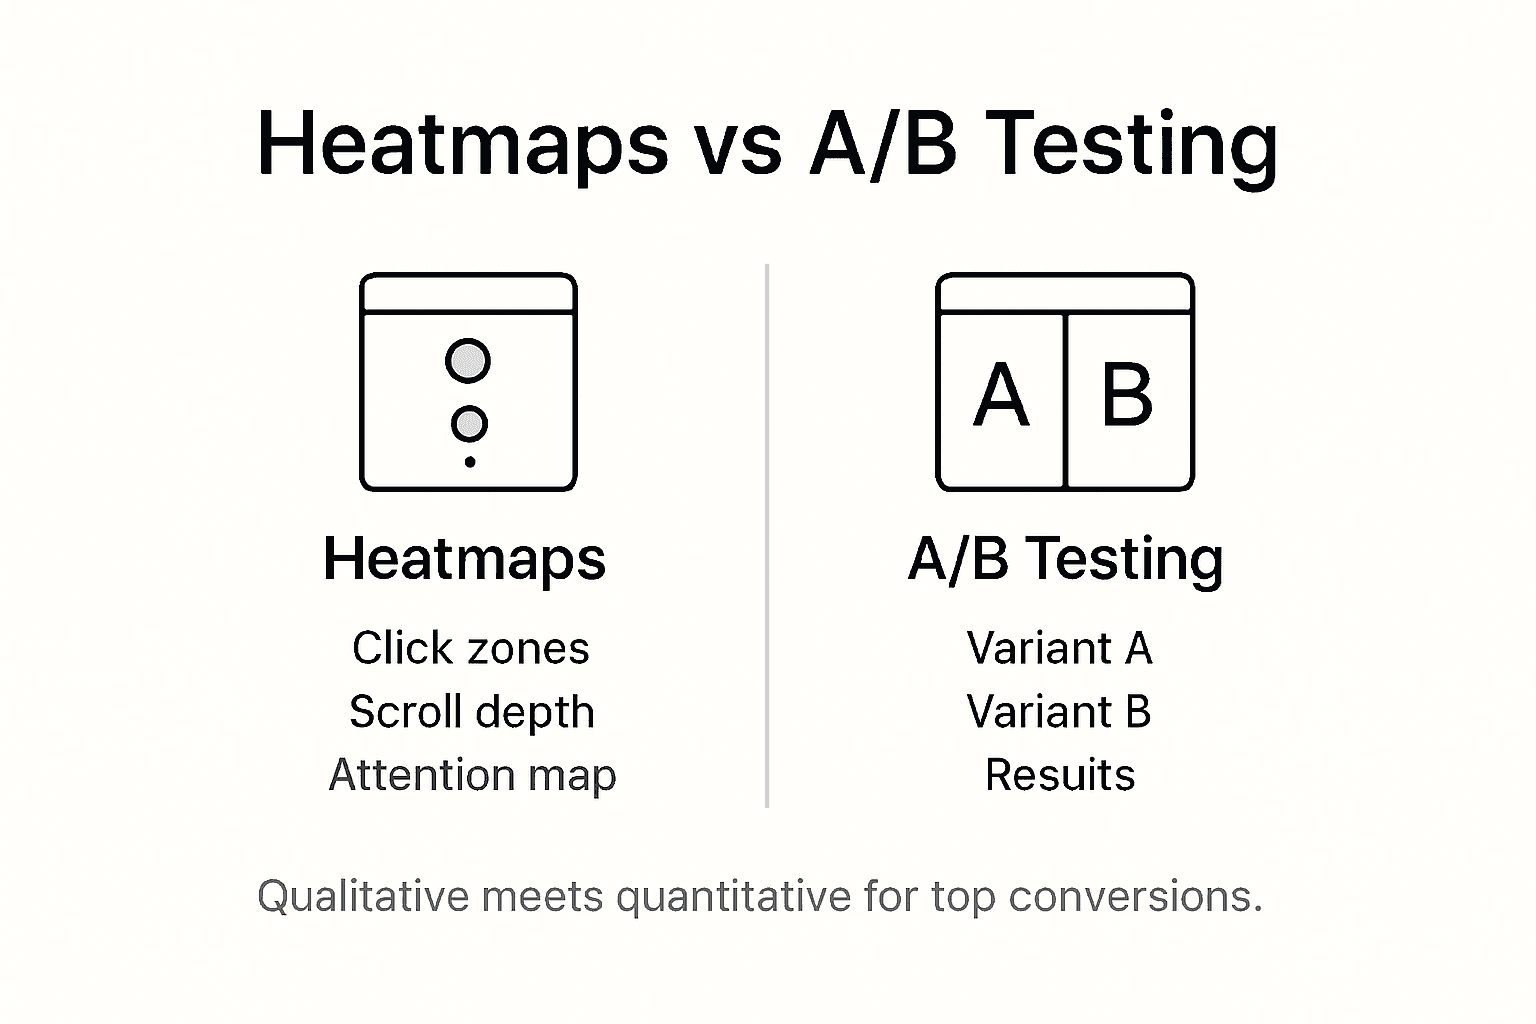
The key difference between heatmaps and A/B testing lies in their approach. Heatmaps offer qualitative insights by showing where users interact, while A/B testing provides quantitative data by measuring which variation performs better. Heatmaps reveal user behavior patterns, highlighting areas of high engagement or potential friction, whereas A/B testing directly tests hypotheses about design changes and their impact on specific conversion goals.

Pro Tip: Combine heatmaps and A/B testing for comprehensive user experience insights by first using heatmaps to identify potential optimization areas, then designing A/B tests to validate your improvement strategies.
Here is a comparison of heatmaps and A/B testing in terms of purpose, data type, and typical application:
| Aspect | Heatmaps | A/B Testing |
|---|---|---|
| Main Purpose | Visualize user interaction patterns | Statistically test design variations |
| Data Type | Qualitative (visual, behavioral) | Quantitative (numeric metrics) |
| Typical Application | Discover engagement hotspots and friction | Validate hypotheses about improvements |
| Business Impact | Guide design tweaks and usability fixes | Directly tie changes to conversion rates |
Key Features and Data Visualization Methods
Heatmaps and A/B testing are powerful analytics techniques with distinct features for understanding user interactions. These tools employ sophisticated data visualization methods to transform complex digital behavior into actionable insights, enabling businesses to make informed design and performance optimization decisions.
Heatmap visualization techniques typically include several specialized approaches. Color gradient systems map user engagement through intuitive visual representations, with different colors indicating varying levels of interaction intensity. The most common heatmap types include:
- Click Heatmaps: Visualize where users click most frequently on web pages
- Scroll Heatmaps: Display how far users scroll and where they typically stop
- Movement Heatmaps: Track mouse movement and hover patterns
- Grid-Based Heatmaps: Segment pages into zones for detailed interaction analysis
A/B testing features focus on quantitative experimentation, allowing marketers to test different variations and measure precise performance metrics. This method involves splitting website traffic between two versions and statistically analyzing which variant produces better conversion rates, engagement levels, or specific user actions.

Pro Tip: Combine heatmap qualitative insights with A/B testing quantitative data to create a comprehensive understanding of user behavior and optimize your digital experience more effectively.
Real-World Use Cases for Marketers
Marketing teams leverage heatmaps and A/B testing to drive strategic improvements across digital platforms. Comprehensive case studies reveal how these analytical tools transform digital marketing performance through targeted experimentation and visualization, enabling data-driven decision making that goes beyond traditional guesswork.
In e-commerce contexts, marketers frequently use heatmaps to understand user navigation patterns and A/B testing to optimize critical conversion elements. For instance, businesses systematically test landing page variations, email campaigns, and website layouts to incrementally improve user engagement and sales performance. These techniques allow for precise interventions such as:
- Repositioning call-to-action buttons
- Adjusting headline copy
- Modifying page layout and design
- Experimenting with pricing presentation
- Optimizing form field placements
Retail and software companies have documented significant improvements using these methods. Some brands have achieved conversion rate increases of 20-50% by implementing insights gained through detailed heatmap analysis and systematic A/B testing. The key is combining qualitative visual data with quantitative experimental results to create a holistic understanding of user behavior.
Pro Tip: Start with high-traffic pages and focus on one variable at a time when conducting A/B tests to ensure clear, actionable insights that can be confidently implemented across your digital platforms.
Strengths and Limitations of Each Approach
Heatmaps and A/B testing each bring unique analytical capabilities to digital marketing optimization. Usability testing research reveals critical insights into their diagnostic value and potential constraints, highlighting the importance of understanding their respective strengths and limitations.
Heatmaps excel at providing visual, intuitive representations of user behavior. Their primary strengths include:
- Immediate visual pattern recognition
- Detailed interaction tracking
- User experience insights without complex analysis
- Low-barrier entry for non-technical marketers
However, heatmaps also present significant limitations. They struggle to directly correlate visual data with specific business outcomes and require substantial user traffic to generate meaningful insights. Without sufficient website visitors, heatmap data can be misleading or statistically insignificant.
A/B testing, conversely, offers rigorous quantitative measurement. Its strengths include precise performance comparisons, statistically validated results, and direct conversion impact assessment. Marketers can definitively determine which version of a webpage, email, or design element generates better results. The primary limitation lies in the complexity of designing statistically sound experiments and the potential for inconclusive results when sample sizes are insufficient.
Pro Tip: Combine heatmap qualitative insights with A/B testing quantitative data to create a comprehensive understanding of user behavior and minimize the individual limitations of each approach.
How to Combine Both for Maximum Results
Conversion optimization demands a strategic approach that leverages both heatmaps and A/B testing for comprehensive insights. By developing an integrated workflow, marketers can transform raw user interaction data into actionable optimization strategies, creating a powerful methodology for digital performance improvement.
The recommended process involves a systematic, multi-stage approach:
- Heatmap Discovery Phase
- Analyze existing website interaction patterns
- Identify user engagement hotspots and friction points
- Detect unexpected navigation behaviors
- Highlight areas of potential conversion resistance
- Hypothesis Generation
- Convert heatmap insights into testable hypotheses
- Design targeted A/B test variations addressing specific user behavior observations
- Prioritize modifications with highest potential impact
Conversion rate optimization workflows benefit from integrating multiple data sources to create robust, evidence-based improvement strategies. By overlaying qualitative heatmap visualizations with quantitative A/B testing results, marketers can develop more nuanced, precise optimization approaches that go beyond single-method analysis.
Pro Tip: Always segment your A/B tests by device type and user context to ensure the insights gained are truly representative of your entire audience's behavior.
The following table summarizes how marketers can sequence and combine both techniques for optimal results:
| Step | Heatmaps Contribution | A/B Testing Contribution |
|---|---|---|
| Discovery | Identify user behavior issues | Not used in this phase |
| Hypothesis | Uncover potential optimization targets | Formulate testable design changes |
| Validation | Not applicable here | Measure impact of proposed changes |
| Iteration | Refine based on new interaction data | Re-test or deploy winning variation |
Accelerate Your Conversion Growth with Streamlined A/B Testing
The article highlights the challenge marketers face when trying to balance qualitative insights from heatmaps with the need for data-driven validation through A/B testing. You want to optimize user behavior efficiently while avoiding complex and slow tools that interrupt your website’s user experience. Key pain points include designing statistically sound experiments and quickly implementing impactful changes based on actionable data. That is where Stellar’s platform delivers a competitive edge.

Experience the fastest A/B testing tool on the market with a lightweight 5.4KB script designed to minimize performance impact. Stellar’s no-code visual editor lets you create and launch dynamic experiments in minutes while tracking advanced goals with real-time analytics tailored for small to medium-sized businesses. Combine your heatmap insights with effortless experimentation to confidently boost conversion rates. Start your journey to better decision-making and higher ROI today at Stellar’s homepage.
Explore how Stellar helps marketers, growth hackers, and product managers run experiments without technical hurdles with this powerful A/B Testing Tool. Unlock the full potential of your campaigns using tools like the Visual Editor and advanced features that simplify optimization so you can focus on strategic growth. Don’t wait to transform valuable insights into measurable wins. Visit https://gostellar.app now and take action with confidence.
Frequently Asked Questions
What is the difference between heatmaps and A/B testing?
Heatmaps provide qualitative insights into user behavior by visually representing where users click, scroll, and engage on a webpage, while A/B testing is a quantitative method that compares two variations of a webpage to determine which performs better based on specific metrics.
How can I use heatmaps to improve my website's user experience?
You can use heatmaps to identify areas of high engagement and friction on your website. This involves analyzing user interactions to make informed design tweaks that enhance usability and guide users more effectively toward conversion points.
Can heatmaps work in conjunction with A/B testing?
Yes, combining heatmaps with A/B testing is highly effective. Heatmaps reveal user behavior patterns, which can help you formulate hypotheses for A/B testing. After conducting tests, you can refine your strategies based on both qualitative heatmap insights and quantitative A/B test results.
What are some common types of heatmaps I should know about?
The most common types of heatmaps include click heatmaps, which show where users click most often; scroll heatmaps, which indicate how far down users scroll on a page; movement heatmaps, which track mouse movements; and grid-based heatmaps that segment pages into zones for more detailed analysis.
Recommended
Published: 12/28/2025