
How to Analyze Test Results for Effective Decision Making
Every great experiment relies on more than luck. Studies show that sloppy data handling can derail over 60 percent of digital tests before real insights even have a chance. Most people assume the biggest breakthroughs come from advanced analytics or clever metrics. The real difference maker is how you collect, organize, and document your results right from the start.
Table of Contents
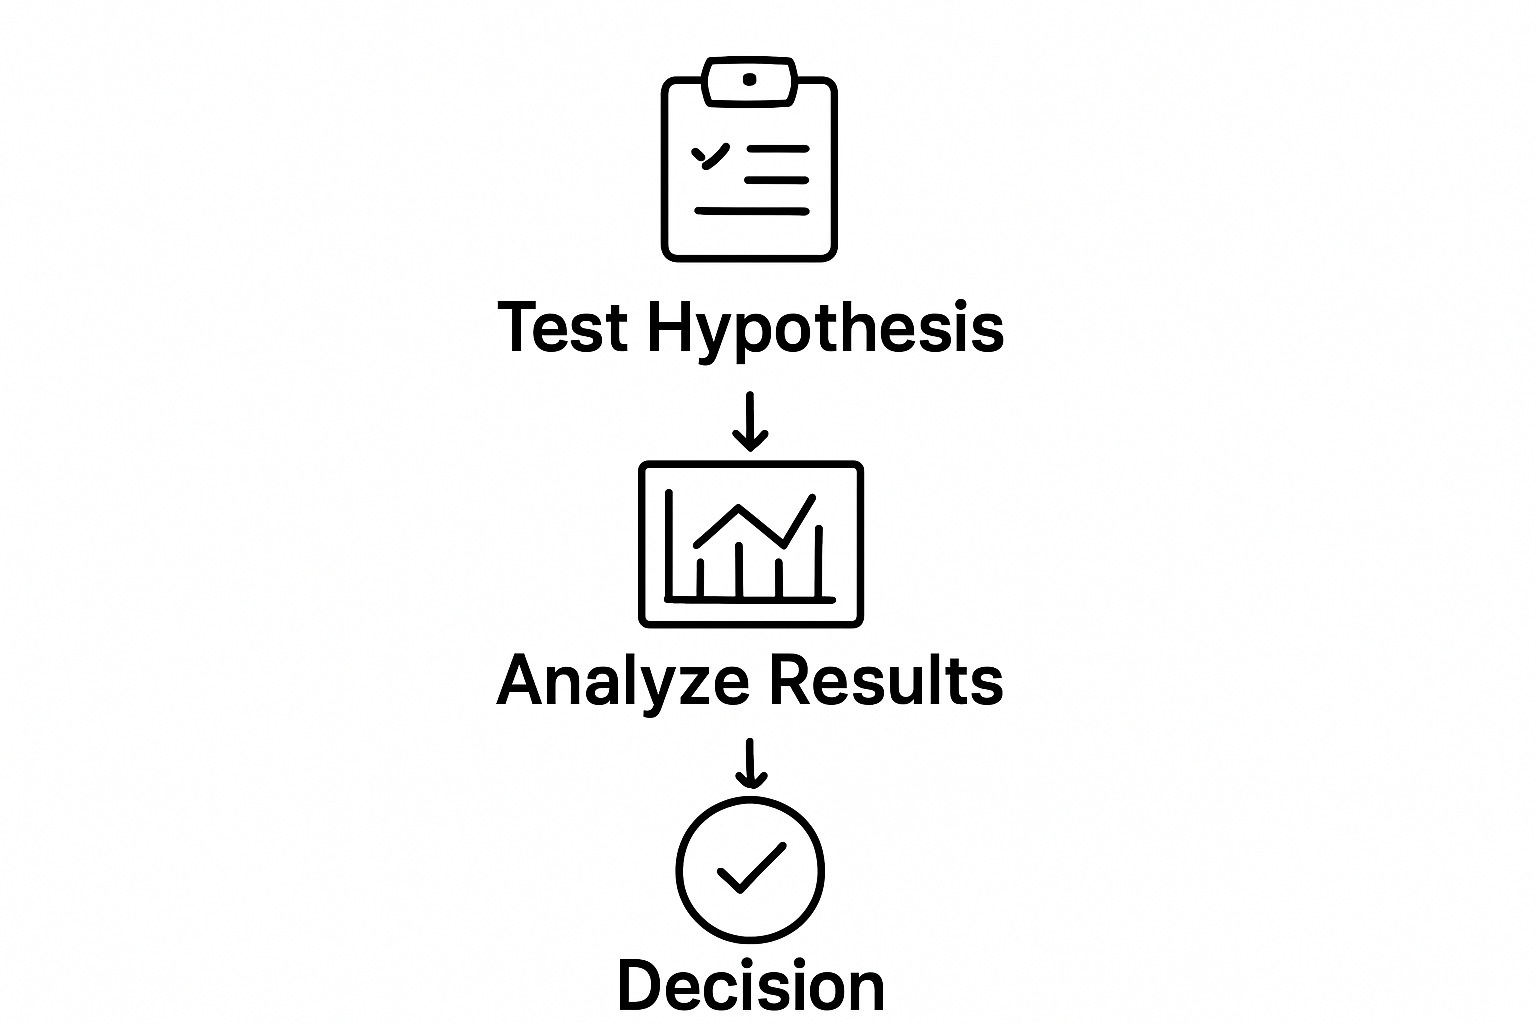
- Step 1: Gather Necessary Data From Tests
- Step 2: Organize Data For Clarity And Insight
- Step 3: Identify Key Metrics To Evaluate
- Step 4: Analyze Results Against Hypotheses
- Step 5: Visualize Findings For Better Understanding
- Step 6: Document Insights For Future Reference
Quick Summary
| Key Point | Explanation |
|---|---|
| 1. Gather Comprehensive Data | Collect all relevant metrics accurately to ensure reliability in decision-making. |
| 2. Organize Data Effectively | Structure data in a way that reveals patterns and trends, making analysis more insightful. |
| 3. Select Relevant Metrics | Choose metrics aligned with testing objectives to provide actionable insights. |
| 4. Analyze Results Objectively | Compare findings against initial hypotheses to draw strategic conclusions from data. |
| 5. Document Insights Thoroughly | Create a comprehensive record of findings and methodology for future reference and learning. |
Step 1: Gather Necessary Data from Tests
Successful test result analysis begins with comprehensive and systematic data collection. Gathering necessary data is the foundational step that determines the accuracy and reliability of your subsequent decision making process. This crucial phase involves capturing all relevant information from your tests with precision and attention to detail.
Start by identifying the specific metrics and data points that are most relevant to your testing objectives. Depending on your project, this might include conversion rates, user engagement statistics, performance indicators, or behavioral metrics. The key is to establish a clear connection between the data you collect and the strategic goals of your test.
To ensure robust data collection, implement a structured approach that captures both quantitative and qualitative information. Your data gathering process should include comprehensive tracking of key performance indicators, user interactions, and contextual details that provide deeper insights into test results. Learn more about creating effective analytics dashboards to streamline your data collection strategy.
Pay special attention to data integrity and consistency. This means establishing standardized collection methods, using reliable tracking tools, and ensuring that your data collection process eliminates potential sources of bias or error. Document your data collection methodology thoroughly, including:
- Data sources and collection methods
- Time frames and specific test parameters
- Tracking tools and technologies used
- Any potential limitations or contextual factors
Effective data gathering requires a meticulous approach that goes beyond simple number collection. Look for patterns, anomalies, and contextual nuances that might not be immediately apparent. Consider collecting both primary metrics directly related to your test objectives and secondary metrics that might provide additional insights into user behavior or system performance.
As you complete this step, verify your data collection by conducting a preliminary review. Ensure that you have captured a comprehensive dataset that provides a complete picture of your test results. This verification process helps identify any potential gaps or areas that might require additional investigation before moving forward with deeper analysis.
Step 2: Organize Data for Clarity and Insight
Transforming raw data into meaningful insights requires a strategic approach to organization that goes beyond simple sorting. The goal of this step is to create a structured framework that reveals patterns, highlights critical information, and enables deeper understanding of your test results. Effective data organization is not just about arranging numbers, but about creating a narrative that speaks to your specific analytical objectives.
Begin by creating a centralized data repository that consolidates all collected information from your previous data gathering efforts. This might involve using spreadsheet software, specialized analytics platforms, or custom database solutions that allow for flexible data manipulation. Explore our guide on choosing the right analytics tools to support your data organization strategy.
Implement a standardized categorization system that allows for easy comparison and cross referencing. This means establishing consistent naming conventions, organizing data by relevant dimensions such as time periods, user segments, or specific test variables. Group similar data points together, creating logical clusters that make it easier to identify trends and relationships that might not be immediately apparent.
Pay special attention to data normalization techniques that help eliminate potential biases and ensure comparability across different datasets. This might involve converting raw numbers into percentage changes, standardizing measurement scales, or applying statistical transformations that provide a more accurate representation of your test results.
Create visual representations of your organized data to enhance understanding. Develop clear, intuitive dashboards or graphical displays that immediately communicate key insights. Your visualization should:
- Highlight significant trends and patterns
- Provide context for numerical results
- Allow for quick comprehension of complex data relationships
- Facilitate easy communication of findings to stakeholders
Verify your data organization by conducting a comprehensive review. Ensure that your structured approach allows for multiple levels of analysis, from high level overviews to granular details. A well organized dataset should enable you to zoom in and out of your data effortlessly, revealing insights at every level of examination.
The ultimate test of your organization is whether someone unfamiliar with the original data can quickly understand the key findings and their implications.
Step 3: Identify Key Metrics to Evaluate
Identifying the right metrics is the critical bridge between raw data and meaningful insights. This step transforms your organized data into a strategic framework that reveals the true performance and impact of your tests. The goal is to select metrics that directly align with your core business objectives and provide actionable intelligence for decision making.
Begin by clearly defining the primary objectives of your test. Different tests require different metric focus points. For a conversion optimization test, you might prioritize metrics like conversion rate, average order value, or user engagement time. A product feature test might emphasize user adoption rates, feature usage frequency, or user satisfaction scores. Discover more about comprehensive test result reporting to refine your metric selection process.
Consider both quantitative and qualitative metrics to create a comprehensive evaluation framework. Quantitative metrics provide numerical evidence of performance, while qualitative metrics offer deeper context and user experience insights. This balanced approach ensures you capture not just what happened, but why it happened.
Develop a hierarchy of metrics that distinguishes between primary and secondary indicators. Primary metrics are direct measures of your core test objectives, while secondary metrics provide additional context and help explain the primary results. For instance, if your primary metric is conversion rate, secondary metrics might include bounce rate, time on page, or user flow progression.
Ensure your selected metrics possess several key characteristics:
- Measurability: Can be accurately tracked and quantified
- Relevance: Directly connected to your specific test objectives
- Sensitivity: Capable of detecting meaningful changes
- Comparability: Allow for consistent measurement across different test variations
Implement a systematic approach to metric selection that involves cross functional collaboration. Engage stakeholders from different departments to validate that the chosen metrics provide a holistic view of test performance. This collaborative process helps prevent narrow or biased metric selection and ensures alignment with broader organizational goals.
Finalize your metric selection by conducting a preliminary validation. Verify that each chosen metric provides clear, actionable insights and can be reliably measured. The ultimate test of your metric framework is its ability to guide meaningful decision making and drive strategic improvements across your organization.
Step 4: Analyze Results Against Hypotheses
Comparing test results against your original hypotheses is the critical moment where data transforms into strategic insight. This step bridges the gap between raw data collection and meaningful decision making, requiring a systematic and objective approach to evaluating your test outcomes. The primary objective is to determine whether your initial assumptions were supported, challenged, or completely overturned by the empirical evidence.
Begin by revisiting the original hypotheses you established before conducting the test. These hypotheses serve as your analytical north star, providing a clear framework for interpreting the collected data. Explore comprehensive AB test hypothesis examples to refine your understanding of effective hypothesis formulation and evaluation.
Apply statistical analysis techniques that match the nature of your test and the metrics you identified earlier. This might involve calculating statistical significance, comparing confidence intervals, or using specific statistical tests like t tests or chi square analyses. The goal is to move beyond surface level observations and determine whether the observed differences are meaningful or potentially due to random chance.
Consider both the statistical significance and the practical significance of your results. Statistical significance tells you whether an observed difference is likely not due to random variation, while practical significance helps you understand whether the observed difference is substantial enough to warrant actionable changes. A statistically significant result that offers minimal practical impact might not justify major strategic shifts.
Evaluate your results through multiple lenses to ensure comprehensive understanding. This means looking beyond simple pass or fail determinations and exploring nuanced insights:
- Unexpected positive outcomes that reveal new opportunities
- Negative results that provide critical learning about user behavior
- Marginal differences that suggest subtle but important patterns
- Potential confounding factors that might have influenced the results
Develop a structured approach to hypothesis validation that includes both quantitative assessment and qualitative interpretation. This involves not just comparing numbers, but understanding the underlying mechanisms that drove your test results. Look for consistent patterns across different segments, identify potential interaction effects, and consider how the results align with or challenge your existing understanding of the system or process being tested.
Verify your analysis by conducting a comprehensive review that cross references your statistical findings with your original research objectives. The ultimate validation comes from answering a simple question: Do these results provide actionable insights that can drive meaningful improvement in your strategy or performance?
Step 5: Visualize Findings for Better Understanding
Transforming complex data into clear, compelling visual representations is the art of making insights instantly comprehensible. Visualization bridges the gap between raw numbers and strategic understanding, enabling faster and more intuitive decision making across your organization. The goal is to create visual narratives that communicate your test findings with precision and impact.
Begin by selecting visualization techniques that match the nature of your data and the story you want to tell. Different data types require different visual approaches. Line graphs work brilliantly for tracking changes over time, bar charts excel at comparing categorical data, scatter plots reveal correlations, and heat maps can showcase intensity and distribution. Explore advanced split test result visualization methods to expand your visualization toolkit.
Prioritize clarity and simplicity in your visual representations. Avoid cluttered designs that overwhelm viewers. Each visualization should communicate its key message within seconds, allowing stakeholders to grasp critical insights without requiring extensive technical knowledge. Use color strategically to highlight important variations, but maintain a consistent and professional color palette that doesn't distract from the core information.
Consider creating multiple visualization layers that allow for different levels of data exploration. Start with high level overview graphics that provide immediate insights, then design more detailed visualizations that enable deeper investigation. This approach accommodates various stakeholder needs, from executive summaries to granular technical analyses.
Incorporate essential visualization best practices:
- Use clean, readable typography
- Maintain consistent scaling and proportions
- Include clear legends and axis labels
- Provide context through brief explanatory annotations
- Ensure color blind friendly design
Enhance your visualizations by adding contextual information that helps viewers understand the significance of the data. This might include comparative benchmarks, historical trends, or brief explanatory notes that provide additional perspective. The most effective visualizations don't just display data they tell a compelling story that guides decision making.
Verify the effectiveness of your visualizations by conducting a simple comprehension test. Share your graphics with colleagues who were not involved in the original analysis and ask them to explain the key findings. If they can quickly and accurately interpret the visualization, you have successfully transformed complex data into actionable insights.
Step 6: Document Insights for Future Reference
Transforming ephemeral test results into lasting organizational knowledge requires a systematic and comprehensive documentation approach. This critical step ensures that the valuable insights gained from your analysis become a strategic asset, accessible and meaningful for future decision making. Documentation is not merely about recording numbers, but about creating a narrative that captures the nuanced learnings from your test.
Establish a standardized documentation template that captures the holistic context of your test results. Explore our comprehensive AB testing checklist to refine your documentation process. Your documentation should include more than just raw data and statistical findings. Create a rich, contextual record that explains the original hypotheses, methodology, key metrics, unexpected discoveries, and potential implications for future strategies.
Implement a clear, consistent structure that makes your documentation easily navigable and understandable. This means organizing information in a logical sequence that tells the complete story of your test. Start with an executive summary that provides quick insights, followed by detailed sections that dive deeper into methodological details, statistical analysis, visual representations, and strategic recommendations.
Include critical contextual information that helps future readers understand the full picture. Document not just what happened, but why it happened, potential external factors that might have influenced the results, and the thought process behind your analysis. This contextual richness transforms your documentation from a mere data record into a valuable learning resource that can guide future testing and strategic planning.
Prioritize documentation elements that provide maximum value:
- Original test objectives and hypotheses
- Detailed methodology and experimental design
- Comprehensive data analysis and statistical findings
- Visualizations that illustrate key insights
- Actionable recommendations and strategic implications
- Potential limitations or areas for further investigation
Create a sustainable documentation system that makes information easily searchable and accessible. Consider using collaborative documentation platforms that allow team members to add comments, highlight key insights, and contribute additional perspectives. The goal is to transform documentation from a static record into a living, evolving knowledge base that continuously supports organizational learning and strategic decision making.
Verify the quality of your documentation by conducting a simple review process. Ask team members who were not directly involved in the test to read through the documentation and provide feedback. If they can understand the test context, findings, and recommendations without additional explanation, you have successfully created a comprehensive and valuable documentation artifact.
Below is a summary checklist table to help you verify the completeness and effectiveness of your test result documentation, based on elements discussed in the guide.
| Documentation Element | Description | Purpose/Outcome |
|---|---|---|
| Test Objectives & Hypotheses | Clearly state original goals and assumptions | Provides context for results |
| Methodology & Experimental Design | Explain test setup and methodology | Allows replication and analysis |
| Data Analysis & Statistical Findings | Summarize key numerical outcomes and significance | Supports evidence-based decisions |
| Visualizations | Include charts or graphs illustrating findings | Enhances understanding and communication |
| Actionable Recommendations | Outline next steps or strategy suggestions | Guides future actions |
| Limitations & Further Investigation | Note constraints or areas needing more research | Informs future testing and learning |
| Contextual Factors | Document external factors influencing results | Adds depth and clarity to conclusions |

Struggling to Turn Test Data Into Real Results? Meet Your Solution
Are you tired of collecting data, trying to organize findings, and still feeling uncertain about which improvements will actually move the needle? The article highlights how vital it is to have a streamlined system for gathering, organizing, and visualizing test data for better decision making. But without the right tools, many marketers hit roadblocks such as inconsistent data, overwhelming spreadsheets, and unclear action steps. If optimizing every marketing experiment feels overwhelming, you're not alone. That's why Stellar was built for marketers and growth teams who need not just results, but clarity and speed.

Stop letting valuable insights get lost in spreadsheets or delayed by technical complexity. With Stellar's lightweight platform, you get real-time analytics, a no-code visual editor, and advanced goal tracking all in one place. Whether you're organizing your A/B test insights or turning raw data into visual narratives for your team, Stellar transforms complicated analysis into clear, actionable steps. Don't wait for confusion to slow down your next campaign. Visit Stellar’s official site right now and experience the difference in how you analyze and act on your test results. Ready to accelerate smarter decision making? Get started with Stellar for free and simplify your next round of testing today.
Frequently Asked Questions
What is the first step in analyzing test results?
Successful test result analysis begins with gathering necessary data from tests, including relevant metrics like conversion rates and user engagement statistics.
How do I organize data for better insights?
Organizing data involves creating a centralized repository, implementing a standardized categorization system, and creating visual representations to highlight key trends and insights.
Why is identifying key metrics important in test analysis?
Identifying the right metrics is essential because they directly align with your core business objectives and provide actionable intelligence for decision-making, helping you evaluate test performance effectively.
How can I visualize findings for better understanding?
You can visualize findings by selecting appropriate visualization techniques, prioritizing clarity and simplicity, and creating multiple layers of visualizations to accommodate different stakeholder needs.
Recommended
Published: 9/11/2025