
How to Benchmark Conversion Rates Effectively in 2025
Every click on your website is a chance to win a customer or lose them for good. Far too many brands obsess over a single conversion percentage and miss the bigger picture. Most businesses never realize that conversion rates can swing more than 300 percent just by tweaking goal definitions and funnel stages. What actually drives real improvement is a relentless focus on pinpointing where your users stumble, then building a system that never stops learning from every result.
Table of Contents
- Step 1: Define Your Conversion Goals And Metrics
- Step 2: Collect Reliable Data For Your Current Rates
- Step 3: Analyze Industry Benchmarks For Comparison
- Step 4: Evaluate Your Conversion Funnel For Insights
- Step 5: Implement Changes Based On Findings
- Step 6: Monitor Results And Adjust Accordingly
Quick Summary
| Key Point | Explanation |
|---|---|
| 1. Clearly Define Conversion Goals | Identify unique conversion goals related to your business outcomes for effective benchmarking. |
| 2. Collect Comprehensive Data | Use advanced analytics tools to gather unbiased data reflecting user interactions across your digital ecosystem. |
| 3. Analyze Industry Benchmarks | Compare your conversion rates with industry standards to contextualize your performance. |
| 4. Evaluate Your Conversion Funnel | Map the customer journey and identify friction points that hinder conversion flow throughout the process. |
| 5. Implement Based on Analytical Insights | Prioritize changes by potential impact, using A/B testing to validate modifications without risking conversions. |
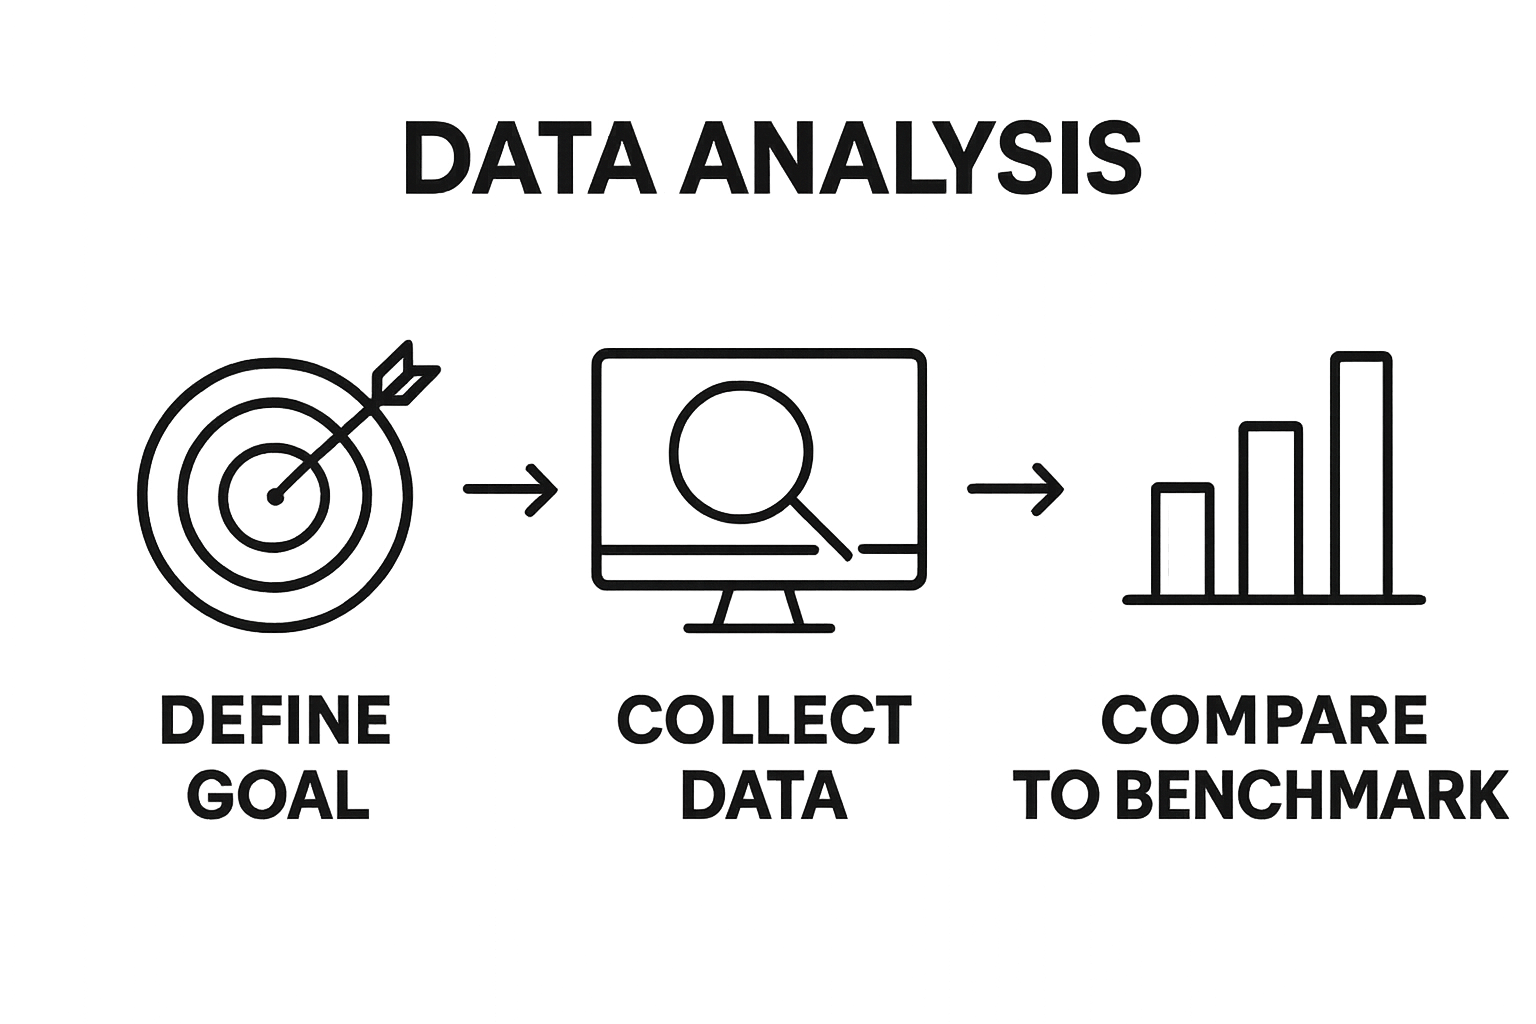
Step 1: Define Your Conversion Goals and Metrics
Successful conversion rate benchmarking begins with crystal clear goal definition. Before diving into complex analytics, you need a precise understanding of what conversion means for your specific business context. Conversion goals are not universal they are unique to each organization's strategic objectives and digital ecosystem.
Start by identifying the most critical actions that directly contribute to your business revenue or growth. For ecommerce websites, this might be completed purchases. For SaaS platforms, conversion could mean trial sign ups or subscription initiations. B2B companies often track lead generation form submissions or consultation request completions. Your conversion goal must connect directly to measurable business outcomes.
To establish meaningful metrics, map out your entire customer journey and pinpoint specific touchpoints where conversions happen. Examine each stage meticulously website visits, product page interactions, cart additions, checkout processes and determine which transitions represent genuine value generation. This comprehensive mapping helps you understand not just the final conversion point but the entire progression leading toward that moment.
Choose metrics that provide actionable insights. Typical conversion rate metrics include:
- Conversion percentage (total conversions divided by total visitors)
- Total conversion value
- Conversion rate by traffic source
- Average time to conversion
Consider leveraging advanced conversion tracking tools that offer granular insights into user behavior. The goal is not just measuring conversions but understanding the nuanced pathways customers take before converting.
Verify your goal definition by asking these questions: Does this metric directly impact revenue? Can it be consistently measured? Will it provide meaningful comparative data? If you can confidently answer yes to these, you have successfully completed the first critical step in benchmarking conversion rates.
Step 2: Collect Reliable Data for Your Current Rates
Data collection represents the foundation of accurate conversion rate benchmarking. Your goal is gathering comprehensive, unbiased information that reflects genuine user interactions across multiple digital touchpoints. The quality of your benchmark depends entirely on the integrity and depth of data you accumulate.
Implementing robust tracking mechanisms is crucial. Start by integrating advanced analytics platforms that capture granular user behavior. Google Analytics, Mixpanel, and specialized conversion tracking tools provide detailed insights into user journeys. Configure these platforms to track specific conversion events aligned with the goals you established in the previous step.
Quality data collection requires multiple measurement perspectives. Web analytics platforms capture quantitative metrics website visits, conversion percentages, and user flow. However, complement these with qualitative insights through user surveys, heatmaps, and session recordings. Tools like Hotjar and Crazy Egg offer visual representations of user interactions, revealing potential friction points in your conversion funnel.
Ensure data collection spans sufficient time to provide statistically significant insights. Minimum recommended tracking period is 30 consecutive days, though 90 days offers more comprehensive trend analysis. This duration helps normalize potential anomalies and provides a more accurate representation of your conversion performance.
Your data collection strategy should include tracking these key metrics:
- Total website visitors
- Unique conversions
- Conversion rate by traffic source
- Conversion rate by user device
- Average time to conversion
Verify your data collection setup by cross referencing multiple analytics platforms and checking for consistent measurement. Learn more about advanced conversion tracking techniques to refine your approach. Successful data collection provides the raw material necessary for meaningful conversion rate benchmarking, transforming abstract metrics into actionable business intelligence.
Below is a checklist summarizing the data collection setup steps to ensure your conversion rate benchmarking is reliable and actionable.
| Step | Verification Question | Purpose |
|---|---|---|
| Define Conversion Goals | Does this metric directly impact revenue? | Ensures goals are business-focused |
| Specify Metrics | Can it be consistently measured? | Confirms data reliability |
| Set Up Tracking Tools | Are advanced analytics platforms tracking key actions? | Guarantees comprehensive data gathering |
| Check Tracking Duration | Does your data cover at least 30 days? | Allows for trend normalization |
| Cross-Reference Data | Are measurements consistent across platforms? | Validates data accuracy |
| Combine Quantitative & Qualitative | Are both web analytics and user insights included? | Offers holistic understanding |
| Review Regularly | Is your data reviewed and updated routinely? | Sustains ongoing relevance |
Step 3: Analyze Industry Benchmarks for Comparison
Industry benchmarks transform raw conversion data into meaningful performance insights. This critical step helps you understand how your conversion rates stack up against competitors and industry standards. Contextualizing your performance requires strategic research and comprehensive analysis.
Begin by identifying authoritative sources for industry specific conversion rate data. Platforms like Similarweb, industry trade associations, and specialized market research firms provide comprehensive benchmark reports. Focus on sources that segment data by your specific business vertical marketing, ecommerce, SaaS, or B2B to ensure accurate comparisons.
Recognize that conversion rates vary dramatically across different industries and business models. A 2% conversion rate might represent exceptional performance in one sector while being underwhelming in another. Pay close attention to nuanced metrics beyond headline conversion percentages. Look for detailed breakdowns by traffic source, device type, and user demographics to create a more holistic understanding of performance benchmarks.
Utilize multiple benchmark sources to create a robust comparative framework. Cross reference data from industry reports, digital marketing publications, and professional networks like LinkedIn research groups. This multi source approach helps normalize potential outliers and provides a more comprehensive view of performance standards.
Key benchmark comparison areas include:
- Median conversion rates for your specific industry
- Conversion rates by traffic source (organic, paid, social)
- Conversion rates by device type (mobile, desktop, tablet)
- Seasonal performance variations
Verify your benchmark analysis by checking for consistent data points across multiple reputable sources. Explore our comprehensive guide on conversion rate benchmarks to refine your understanding. Remember that benchmarks are guidelines not absolute targets. Your unique business context ultimately determines what constitutes a successful conversion rate.
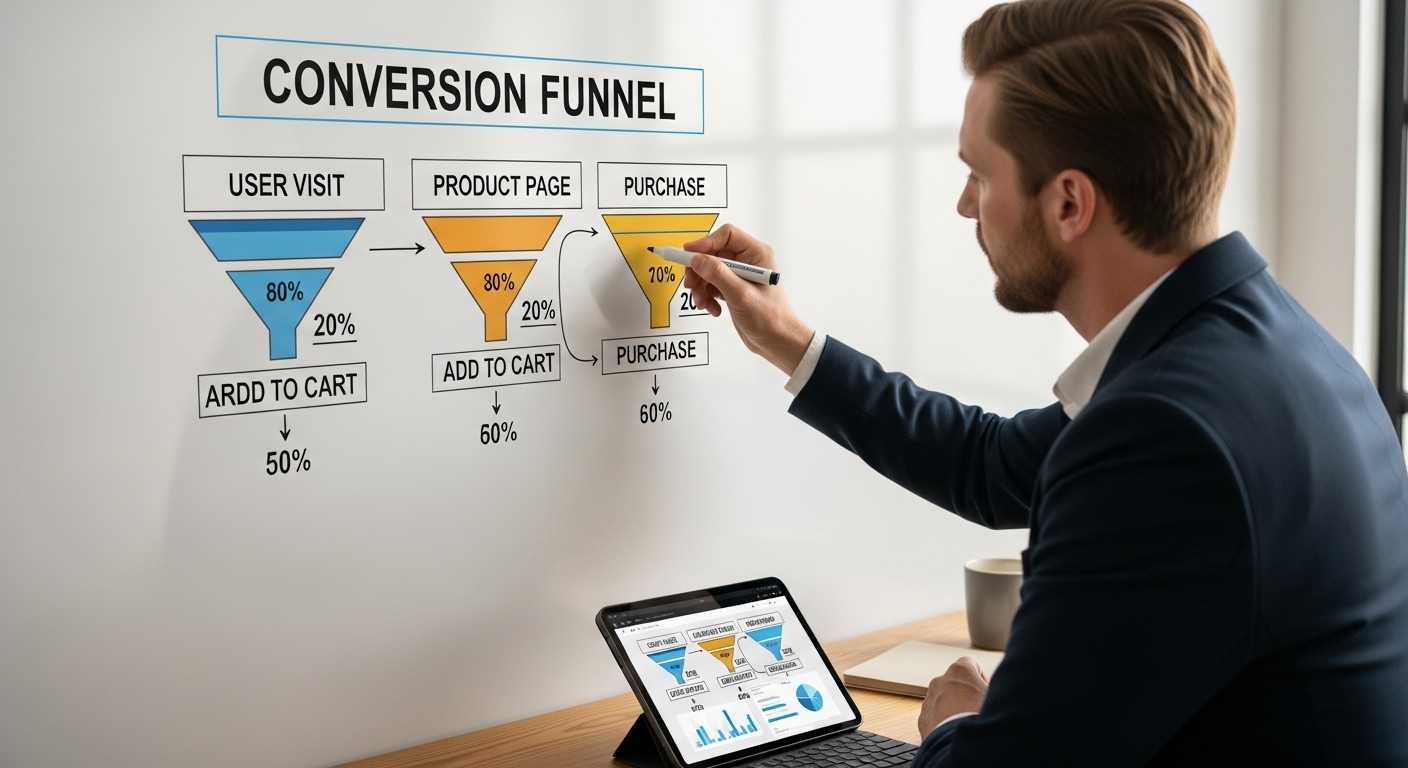
Step 4: Evaluate Your Conversion Funnel for Insights
The conversion funnel represents the strategic pathway through which potential customers transform from initial interest to final purchase. Thoroughly analyzing this journey reveals critical insights into user behavior and potential optimization opportunities. Your goal is to identify friction points that prevent smooth progression through each conversion stage.
Begin by mapping out your entire customer journey visually. Track every interaction from initial website visit to final conversion point. Pay particular attention to drop off rates at each stage website entry, product page views, cart additions, checkout initiation, and final purchase completion. Understand that not all users will progress linearly through your funnel some will skip stages while others will abandon their journey prematurely.
Utilize advanced analytics tools like Google Analytics, Mixpanel, and specialized funnel visualization platforms to capture granular user movement data. These tools provide heat maps, user flow diagrams, and detailed stage by stage conversion percentages. Look for statistically significant patterns that indicate systemic barriers in your conversion process. Common friction points include complex navigation, unclear value propositions, slow page load times, and complicated checkout procedures.
Your funnel evaluation should focus on these critical metrics:
- Conversion rate per funnel stage
- Average time spent at each stage
- Drop off percentages
- Bounce rates
- User segments with highest conversion potential
Pay special attention to micro conversions small user actions that indicate potential future full conversions. Explore our comprehensive guide on understanding conversion funnels to deepen your analysis. Successful funnel evaluation transforms raw data into actionable strategies for improving user experience and increasing overall conversion performance.
Here is a table summarizing common friction points in conversion funnels and the corresponding analytics tools mentioned to identify them, making the funnel evaluation process more actionable.
| Funnel Friction Point | Typical Cause | Recommended Analytics Tool |
|---|---|---|
| High Drop-off Rates | Complex navigation | Google Analytics, Mixpanel |
| Page Abandonment | Slow page loads | Heatmaps (Hotjar, Crazy Egg) |
| Low Cart Additions | Unclear value proposition | Funnel Visualization Platforms |
| Checkout Drop-offs | Complicated process | Session Recordings |
| Low Mobile Conversion | Device-specific issues | Device Segment Reports |
Step 5: Implement Changes Based on Findings
Transforming analytical insights into actionable improvements represents the most critical phase of conversion rate benchmarking. Successful implementation requires a strategic and methodical approach that balances data driven decisions with calculated risk management. Your goal is to translate complex insights into practical optimizations that directly enhance conversion performance.
Prioritize your findings by potential impact and ease of implementation. Not all insights are created equal some will offer transformative improvements while others might provide marginal gains. Create a prioritized roadmap that categorizes potential changes based on expected conversion lift and required resources. Focus first on high impact modifications that can be implemented with minimal technical complexity or financial investment.
Employ a systematic approach to change implementation.
Begin with small controlled experiments using A/B testing methodologies. This approach allows you to validate hypotheses without risking entire conversion streams. Implement changes incrementally test one variable at a time to understand precise cause and effect relationships. Track granular metrics to measure the direct impact of each modification on your conversion rates.
Key implementation strategies include:
- Start with lowest hanging fruit modifications
- Implement changes in controlled test environments
- Monitor performance metrics in real time
- Be prepared to quickly roll back unsuccessful changes
- Document all modifications and their outcomes
Continuous monitoring is essential during this implementation phase. Utilize robust analytics platforms that provide real time performance tracking. Learn advanced techniques for analyzing A/B test results to refine your optimization approach. Remember that conversion rate optimization is an iterative process. Each implemented change provides new data points that inform future strategic decisions, creating a continuous improvement cycle.
Step 6: Monitor Results and Adjust Accordingly
Continuous monitoring transforms conversion rate benchmarking from a static exercise into a dynamic strategic process. Effective result tracking requires establishing a robust measurement framework that captures nuanced performance shifts in real time. Your monitoring approach should combine quantitative metrics with qualitative insights to create a comprehensive performance assessment.
Develop a dedicated analytics dashboard that consolidates key conversion performance indicators. Select tools that offer real time data visualization and automated reporting capabilities. Google Analytics, Mixpanel, and specialized conversion tracking platforms provide comprehensive views of your conversion ecosystem. Configure custom alerts that trigger notifications when critical metrics deviate from expected ranges, enabling rapid response to emerging trends or potential performance declines.
Establish a consistent review cadence for your conversion performance. Weekly deep dive analyses provide sufficient granularity to detect meaningful patterns without overwhelming your team with excessive data. Compare current performance against your established benchmarks, industry standards, and previous optimization iterations. Look beyond surface level conversion rates and examine underlying behavioral metrics that indicate user engagement and potential friction points.
Key monitoring elements to track:
- Conversion rate fluctuations
- User behavior changes
- Segment specific performance variations
- Unexpected drop off points
- Emerging user interaction patterns
Be prepared to implement agile adjustments based on your monitoring insights. Some changes might require immediate intervention, while others could inform longer term strategic planning. Explore advanced analytics dashboard techniques to enhance your monitoring capabilities. Remember that successful conversion rate optimization is an ongoing journey of incremental improvements, not a destination. Your willingness to continuously learn, adapt, and refine your approach will determine long term success.
Ready to Turn Your Conversion Data Into Growth?
You have just learned strategies to benchmark and optimize conversion rates. Now comes the real challenge: turning those analytics into repeatable results. If tracking every touchpoint, analyzing user journeys, and running controlled A/B tests sounds overwhelming, you are not alone. Many marketers and product managers face the pain of slow, complex optimization tools and incomplete data. This often leads to missed opportunities and frustrating guesswork, rather than real growth. With industry demands for faster decisions and cleaner user experiences, you need a platform designed for your goals in 2025.

Stellar makes it simple to benchmark, test, and improve your conversion funnel—no code required. Create experiments seamlessly using our no-code visual editor, track advanced goals in real time, and iterate quicker than your competitors. Join small and medium businesses that choose Stellar’s lightweight solution for fewer obstacles and bigger wins. Visit Stellar’s homepage to start free and see the immediate impact on your data-driven growth journey.
Frequently Asked Questions
What are conversion goals, and why are they important for benchmarking?
Conversion goals are specific actions that directly contribute to your business outcomes, such as completed purchases for e-commerce or trial sign-ups for SaaS platforms. They are essential for benchmarking because they provide a clear target for measuring the effectiveness of your marketing efforts and overall business performance.
How should I collect data for accurate conversion rate benchmarking?
To collect reliable data, implement robust tracking mechanisms using advanced analytics platforms. Gather quantitative metrics such as website visits and conversion percentages, while also incorporating qualitative insights from user surveys and heatmaps to create a comprehensive view of user interactions.
What metrics should I focus on when analyzing conversion rates?
Key metrics to focus on include conversion percentage, total conversion value, conversion rates by traffic source and user device, and average time to conversion. These metrics provide actionable insights into your conversion performance and user behavior.
How can I use industry benchmarks to evaluate my conversion rates?
Using industry benchmarks, you can compare your conversion rates against competitors and industry standards. Focus on segmenting data by your business vertical and analyzing nuanced metrics beyond just headline conversion percentages to gain a holistic understanding of your performance.
Recommended
- Conversion Rate Benchmarks 2025: What Marketers Must Know
- Boost Your Ecommerce Conversion Rate: Proven Tactics for More Sales
- Conversion Tracking for Beginners: 2025 Guide for Marketers
- Understanding Click-Through Rates: Essential Guide for Marketers 2025
- Converting Website Traffic: Proven Strategies for 2025
Published: 9/24/2025