
How to Test Pricing Pages for Maximum Conversions
Tweaking your pricing page even slightly can lead to surprising results and the numbers prove it. Businesses have seen conversion rates jump by up to 15% just by making data-driven changes to their pricing layout. Most people obsess over creative design or catchy copy and forget the real wins hide in small details you can actually measure. The secret is not a total redesign but carefully testing and tracking exactly what works for your users.
Table of Contents
- Step 1: Analyze Current Pricing Page Performance
- Step 2: Define Testing Objectives And Success Metrics
- Step 3: Create Variations Of Your Pricing Page
- Step 4: Implement A/B Testing For Effective Comparisons
- Step 5: Monitor Results And Gather User Feedback
- Step 6: Optimize Based On Insights And Verify Changes
Quick Summary
| Key Point | Explanation |
|---|---|
| 1. Analyze your pricing page performance | Gather analytics to understand user interactions and identify conversion barriers on your current pricing page. |
| 2. Define clear testing objectives | Set measurable goals and success metrics that guide your testing process for effective optimization. |
| 3. Create variations strategically | Design alternative pricing page layouts to test specific elements while keeping brand messaging consistent. |
| 4. Implement A/B testing rigorously | Use A/B testing platforms to compare variations against the original page, ensuring statistically valid results. |
| 5. Monitor results and gather feedback | Collect detailed performance metrics and user feedback to inform ongoing optimization of your pricing page. |
Step 1: Analyze Current Pricing Page Performance
Analyzing your current pricing page performance is the critical foundation for strategic optimization. This initial diagnostic step allows you to understand exactly how potential customers interact with your pricing structure and identify specific areas preventing conversions.
Begin by gathering comprehensive analytics data from your existing pricing page. Google Analytics provides an excellent starting point for tracking key metrics. Focus on critical performance indicators like conversion rate, time spent on page, and bounce rate. These metrics reveal how effectively your current pricing page communicates value and persuades visitors to take action.
Implement heat mapping tools such as Hotjar to gain visual insights into user behavior. These tools generate color-coded overlays showing precisely where users click, scroll, and pause on your pricing page. By understanding user interaction patterns, you can identify potential friction points or areas of confusion that might be preventing conversions.
Qualitative research complements quantitative data. Conduct user surveys or brief exit interviews to understand why potential customers abandon your pricing page. Ask direct questions about page clarity, perceived value, and any hesitations they experienced. This human-centered approach provides nuanced insights that raw analytics might miss.
Key verification criteria for this step:
- Collected comprehensive pricing page analytics
- Generated heat map visualizations
- Completed user feedback survey
- Identified minimum 3 potential conversion barriers
Your analysis should create a clear blueprint of your pricing page's current performance, setting the stage for targeted optimization in subsequent testing phases.
Here is a checklist to help you verify completion of each critical step when analyzing your current pricing page performance and preparing for optimization:
| Verification Criteria | Description |
|---|---|
| Collected pricing page analytics | Gathered quantitative data from analytics platforms |
| Generated heat map visualizations | Used heat mapping tools to visualize user interactions |
| Completed user feedback survey | Conducted surveys or exit interviews with actual users |
| Identified at least 3 conversion barriers | Pinpointed key friction points preventing conversions |
| By meticulously examining these initial data points, you establish a solid foundation for strategic improvements that can significantly boost conversion rates. |
Step 2: Define Testing Objectives and Success Metrics
Defining clear testing objectives and success metrics transforms your pricing page optimization from guesswork to strategic experimentation. This crucial step provides a structured framework that guides your entire testing process, ensuring you measure what truly matters for business growth.
Start by identifying specific, measurable goals for your pricing page. Conversion rate improvement typically serves as the primary objective, but dig deeper into nuanced metrics that reveal genuine user engagement. Consider tracking metrics like average time on page, scroll depth, and interaction with pricing elements. These indicators provide a more comprehensive understanding of how potential customers engage with your pricing structure.
Establish quantitative benchmarks that represent meaningful improvement. Rather than vague aspirations, set precise targets such as increasing conversion rates by 15% or reducing page abandonment by 20%. According to NIST research, clearly defined objectives are fundamental to meaningful experimental design.
Key verification criteria for this step:
- Defined primary conversion goal
- Established 2-3 secondary performance metrics
- Created specific, numeric improvement targets
- Identified potential measurement tools
Consider both immediate and long-term impacts when designing your testing objectives. Short-term conversion improvements matter, but sustainable user experience enhancements provide lasting value. Balance quantitative metrics with qualitative insights that reveal deeper user motivations and potential friction points in your pricing presentation.
Remember that successful testing objectives act as a roadmap, guiding your optimization efforts with precision and purpose. By meticulously defining what success looks like before beginning experiments, you create a robust framework for systematic pricing page improvement.
Step 3: Create Variations of Your Pricing Page
Creating strategic variations of your pricing page transforms data-driven insights into actionable optimization opportunities. This step involves thoughtfully designing alternative page layouts that challenge your current design while maintaining core messaging and brand integrity.
Focus on testing one significant element at a time to ensure clear, attributable results. Potential variation areas include pricing presentation, color schemes, call-to-action button placement, feature descriptions, and social proof elements. By isolating specific variables, you'll gain precise understanding of what truly influences user conversion behaviors.
Leverage visual design tools like Figma to prototype variations efficiently. Develop 2-3 alternative designs that fundamentally differ in their approach to communicating value. For instance, one variation might emphasize annual pricing discounts, while another could highlight individual feature benefits more prominently. According to Interaction Design Foundation, effective A/B testing requires fully functional variations that provide genuine user experience alternatives.
Key verification criteria for this step:
- Created minimum 2 distinct pricing page variations
- Ensured each variation tests a specific, isolated design element
- Validated technical functionality of all variations
- Confirmed brand consistency across design alternatives
When designing variations, maintain a balance between creativity and strategic intentionality. Each design should represent a meaningful hypothesis about user preferences and conversion potential. Your goal is not merely to create different layouts, but to generate insights that reveal deeper understanding of customer decision-making processes.
Remember that successful variations are grounded in your initial performance analysis and clearly defined testing objectives. By carefully crafting alternative pricing page designs, you set the stage for data-driven optimization that can significantly enhance your conversion rates.

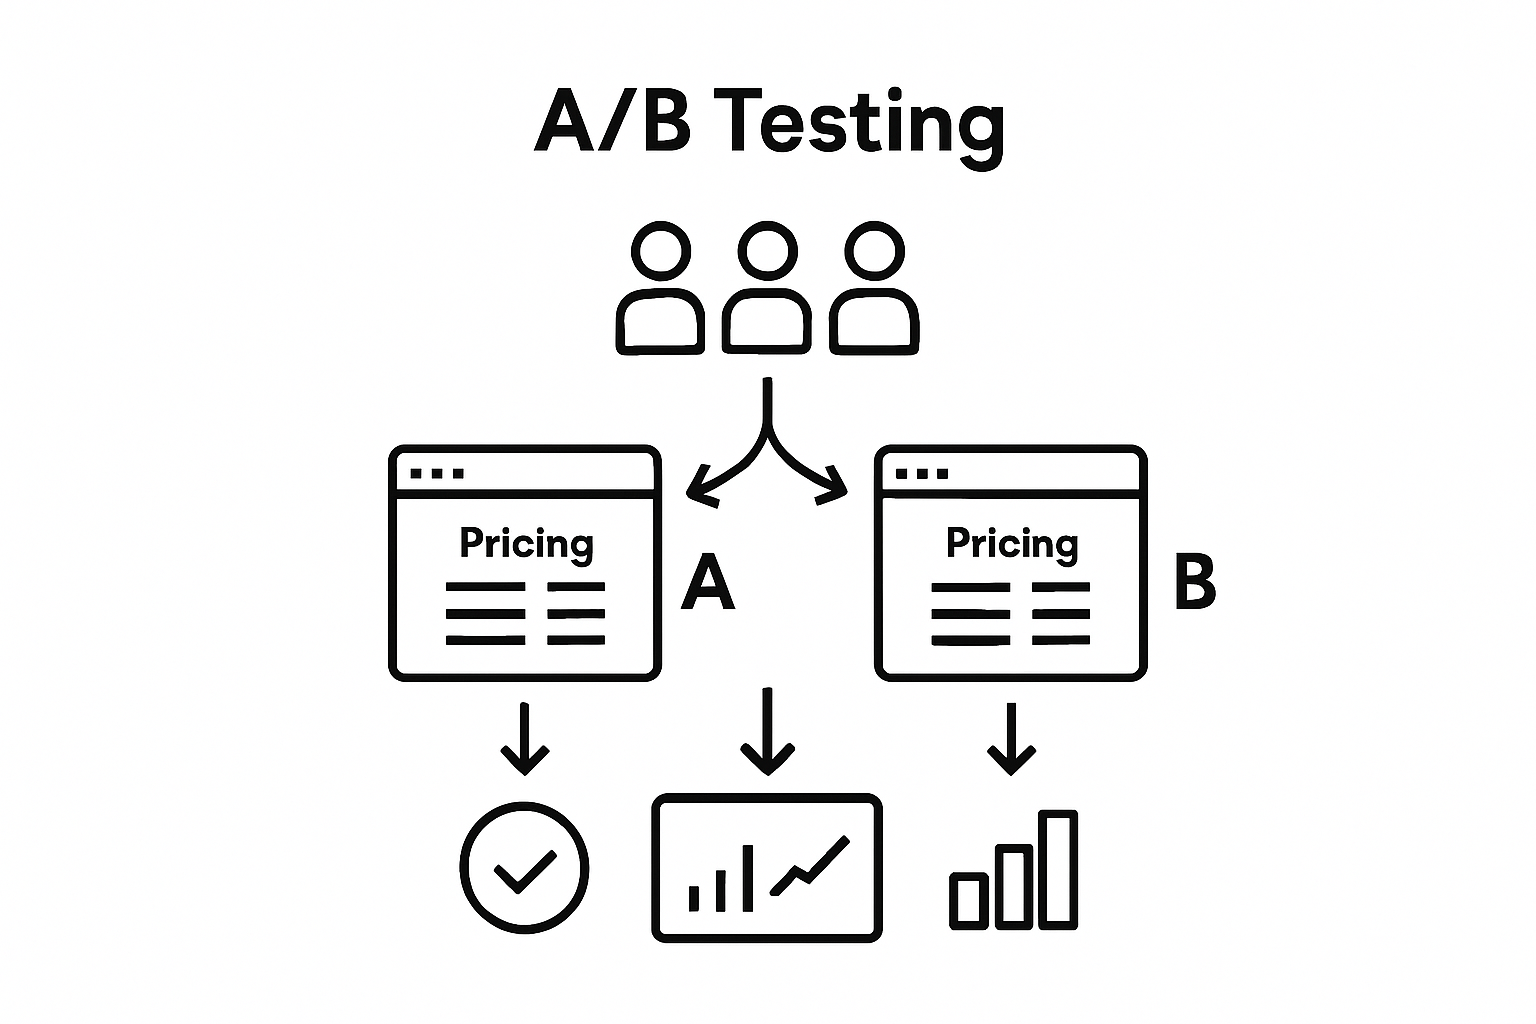
Step 4: Implement A/B Testing for Effective Comparisons
Implementing A/B testing transforms your pricing page optimization from theoretical strategy into measurable, actionable insights. This critical step involves systematically comparing your original pricing page against carefully designed variations to determine which approach most effectively drives conversions.
Statistical significance is the cornerstone of meaningful A/B testing. Utilize robust testing platforms like Optimizely or Google Optimize to ensure your experiments provide statistically reliable results. Set your confidence level to at least 95%, which means you can be confident that observed differences are not random occurrences but genuine performance variations.
Carefully configure your test parameters to divide traffic evenly between your original and variant pricing pages. Aim to collect a substantial sample size - typically between 1,000 to 5,000 unique visitors per variation. This approach ensures you capture a representative view of user behavior and minimize the risk of drawing conclusions from limited data.
Key verification criteria for this step:
- Configured A/B testing platform with 95% confidence level
- Established equal traffic distribution between variations
- Set clear test duration (minimum 2 weeks recommended)
- Defined primary and secondary success metrics
According to research in user experience design, effective A/B testing requires meticulous attention to experimental design. Monitor your test closely, but resist the temptation to interrupt or modify parameters midway. Consistent, uninterrupted data collection provides the most reliable insights into user preferences and conversion behaviors.
Remember that A/B testing is an iterative process. Each test provides valuable insights, even if the results aren't what you initially anticipated. The goal is continuous learning and incremental improvement of your pricing page's performance. By approaching A/B testing with patience, precision, and a commitment to data-driven decision-making, you'll unlock powerful strategies for optimizing your conversion rates.
Step 5: Monitor Results and Gather User Feedback
Monitoring results and gathering user feedback transforms raw data into actionable insights that drive meaningful pricing page optimization. This step bridges quantitative metrics with qualitative understanding, providing a holistic view of your testing efforts.
Utilize comprehensive analytics platforms like Google Analytics to track detailed performance metrics beyond basic conversion rates. Examine nuanced indicators such as time on page, scroll depth, and interaction patterns across different pricing page variations. These granular insights reveal not just whether users convert, but how they engage with your pricing structure.
Implement targeted user feedback mechanisms to complement your analytical data. Hotjar offers powerful survey and feedback tools that can capture real-time user perspectives. Design concise, specific questions that probe user decision-making processes. Ask about pricing clarity, perceived value, and any hesitations encountered during the purchase journey.
Key verification criteria for this step:
- Collected comprehensive performance analytics
- Conducted user feedback survey
- Analyzed qualitative and quantitative data
- Identified potential optimization opportunities
According to research from the National Network of Libraries of Medicine, effective feedback collection requires carefully designed questions that provide meaningful insights. Approach user feedback as a collaborative dialogue, not just a data extraction exercise. Look for patterns and recurring themes that might not be immediately apparent in numerical metrics.
Remember that monitoring results is an ongoing process. Your initial test provides a snapshot, but continuous observation and iterative improvements will ultimately drive long-term conversion success. By combining rigorous data analysis with genuine user insights, you create a powerful optimization strategy that goes beyond surface-level changes.
Step 6: Optimize Based on Insights and Verify Changes
Optimizing your pricing page based on collected insights transforms data into strategic improvements that directly impact conversion rates. This critical step involves translating your testing results into actionable enhancements that meaningfully address user behavior and preferences.
Begin by prioritizing insights that demonstrate statistically significant impact. Focus on changes that directly influence user decision-making, such as pricing presentation, feature descriptions, or value proposition clarity. Not all variations will yield substantial improvements, so be discerning in selecting which optimizations to implement.
Implement changes incrementally and strategically. Avoid wholesale redesigns that might introduce unexpected user friction. Instead, make targeted modifications informed by your A/B testing data. For instance, if your test revealed that simplified pricing tiers increased conversions, gradually refine your page's layout to emphasize this clarity.
Key verification criteria for this step:
- Identified statistically significant optimization opportunities
- Developed implementation plan for top-performing variations
- Created tracking mechanisms for new page design
- Established baseline metrics for comparison
According to Penn State Extension's research, optimization is an iterative process. Plan to conduct subsequent testing rounds to validate and further refine your improvements. Each optimization cycle provides deeper insights, allowing you to progressively enhance your pricing page's performance.
Remember that optimization is not a one-time event but a continuous journey of incremental improvements.
This table summarizes the main steps to optimize your pricing page, including their primary objectives and recommended tools for successful execution:
| Step | Purpose | Recommended Tools |
|---|---|---|
| Analyze Current Performance | Identify conversion barriers and user behaviors | Google Analytics, Hotjar |
| Define Objectives and Metrics | Set measurable goals and tracking KPIs | Google Analytics, Surveys |
| Create Page Variations | Design alternative layouts for data-driven testing | Figma, Design Platforms |
| Implement A/B Testing | Compare original and variant pages for impact | Optimizely, Google Optimize |
| Monitor Results & Gather Feedback | Evaluate effectiveness and collect user insights | Google Analytics, Hotjar |
| Optimize and Verify | Apply successful changes and confirm improvements | Analytics tools, A/B Testing Tools |
| By maintaining a data-driven, user-centric approach, you'll create a pricing page that not only looks appealing but effectively guides potential customers toward conversion. Stay curious, remain adaptable, and view each test as an opportunity to better understand and serve your audience. |
Tired of Guesswork in Your Pricing Page Optimization?
If you have ever struggled with low conversion rates or confusing user interactions on your pricing page, you know the frustration of seeing visitors abandon their journey. The article "How to Test Pricing Pages for Maximum Conversions" walks you through gathering data, running structured A/B tests, and finding actionable insights. But as a marketer or product manager, you may still hit obstacles like complicated tools, slow set-ups, or unclear analytics. You want painless, fast experiments that give you instant clarity—without the technical headaches.
Ready for a better way? At Stellar, our no-code A/B Testing Tool is built for businesses just like yours. Effortlessly create and compare pricing page variations in minutes. Access real-time analytics, pinpoint conversion barriers, and act on instant feedback, all while preserving your website speed with our ultra-lightweight script.

Stop letting uncertainty stall your growth. Take your next step now and start optimizing for higher conversions today at Stellar. Make data-driven decisions with confidence—see how easy pricing page testing should be.
Frequently Asked Questions
What are the key metrics to analyze when testing pricing pages?
To effectively test pricing pages, focus on metrics such as conversion rate, time spent on the page, and bounce rate. These indicators help reveal how well your pricing structure resonates with potential customers.
How can I gather user feedback on my pricing page?
You can collect user feedback by implementing surveys through tools like Hotjar. Ask specific questions about pricing clarity and perceived value to understand customer hesitations.
What is A/B testing and why is it important for pricing pages?
A/B testing involves comparing your current pricing page with variations to determine which design drives better conversions. It is important because it provides statistically reliable insights into user preferences, allowing for informed optimization.
How should I prioritize changes based on A/B testing results?
Focus on implementing changes that demonstrate a statistically significant impact on user behavior. Target specific areas like pricing presentation and clarity that directly influence customer decision-making.
Published: 9/1/2025