
Throughput in performance testing: The marketer's guide
TL;DR:
- Throughput measures how many users a system can serve simultaneously without failure.
- Measuring throughput at peak loads prevents false test results and conversion drops.
- Optimizing for both speed and capacity ensures scalable, reliable marketing campaign performance.
You launch an A/B test, your variant loads fast, the analytics look clean, and you declare a winner. Then you roll it out site-wide and conversions tank. What went wrong? For most small and medium-sized business (SMB) marketers, the answer is throughput: a metric they never checked. Page speed tells you how fast one user gets a response. Throughput tells you how many users your system can actually serve at once without breaking. Missing this distinction costs real revenue, invalidates test results, and turns confident marketing decisions into expensive guesses. This guide clarifies what throughput is, how to measure it, and how to apply it in real A/B testing decisions.
Table of Contents
- What is throughput in performance testing?
- Measuring throughput: Tools, methods, and reporting
- Throughput in action: A/B testing and optimization
- Beyond the basics: Healthy throughput, benchmarks, and pitfalls
- The overlooked lesson: Why throughput is the marketer's secret conversion weapon
- Next steps: Optimize your performance testing with Stellar
- Frequently asked questions
Key Takeaways
| Point | Details |
|---|---|
| Throughput explained | Throughput measures how many requests or transactions your system completes per second. |
| Measure what matters | Reliable throughput metrics prevent false positives and missed conversion gains in A/B testing. |
| Benchmark and avoid bottlenecks | Compare your results to real-world throughput data and monitor for error rates and traffic-induced drops. |
| Optimize for stability | Stable throughput under load outperforms short-term speed fixes for long-term growth. |
What is throughput in performance testing?
Let's cut through the jargon. Throughput in performance testing is the amount of data or number of transactions a system processes per unit of time, typically measured in requests per second (RPS) or transactions per second (TPS). Think of it as a highway: throughput is how many cars pass through per minute, not just how fast any single car drives.
That single-car speed is latency, which measures the time it takes for one request to complete. Bandwidth, on the other hand, is the theoretical maximum number of cars the highway could carry under perfect conditions. Real-world performance shows that throughput differs from bandwidth (theoretical max capacity) and latency; high throughput with low latency is ideal, but they trade off significantly under high load due to what engineers call Little's Law.
Here is a simple breakdown of the three metrics:
| Metric | What it measures | Example unit |
|---|---|---|
| Throughput | Actual processing rate | Requests per second (RPS) |
| Latency | Delay for a single transaction | Milliseconds (ms) |
| Bandwidth | Theoretical max volume | Megabits per second (Mbps) |
The formula for throughput is straightforward. It is calculated as total requests divided by total time taken. For example, 300 requests completed in 5 seconds equals 60 RPS. That number is your baseline.
Why does this matter for marketers? Because a variant can look fast under a small test sample and still collapse when real traffic hits. A system serving 10 simulated users might return pages in 300ms. Serve 500 users simultaneously and that same system might queue requests, error out, or silently degrade, all while your A/B test keeps recording data. The result is a "winner" that never actually wins at scale.
Here is what understanding throughput helps you avoid:
- Misreading fast-but-fragile systems as production-ready
- False positives in A/B results caused by uneven server load across variants
- Unexpected conversion drops after a winning variant rolls out to full traffic
- Wasted development resources spent on optimizations that do not hold under real load
For SMB teams running load testing explained for the first time, throughput is often the first metric that reveals a real capacity problem. Once you understand it, you cannot unsee it.
Measuring throughput: Tools, methods, and reporting
Knowing the definition is just the start. The real work is measuring throughput in a way that produces actionable results for your team. Most SMBs do not need enterprise-grade infrastructure to do this well.
In JMeter load testing, throughput is tracked via listeners like the Aggregate Report, which lets you assess system capacity under simulated loads using thread groups and timers such as the Constant Throughput Timer. JMeter is free and widely supported, making it a strong starting point for marketing and product teams.

Here is a side-by-side comparison of the most common throughput testing tools for SMB use:
| Tool | Best for | Throughput reporting | Learning curve |
|---|---|---|---|
| JMeter | Flexible, general-purpose | Aggregate Report, Summary Report | Moderate |
| Gatling | Dev-friendly, code-based | Real-time dashboards | Steeper |
| k6 | Script-based, CI/CD friendly | Built-in RPS tracking | Low to moderate |
| Locust | Python-based, quick setup | Real-time web UI | Low |
Setting up a basic throughput test in JMeter follows a clear sequence:
- Define your thread group. Set the number of virtual users (threads), ramp-up time, and loop count. Start small, around 50 users over 30 seconds.
- Add HTTP request samplers. Point them to your landing page or variant URLs.
- Insert a Constant Throughput Timer. This controls how many requests per minute JMeter sends, so you can simulate realistic traffic without flooding the server.
- Attach an Aggregate Report listener. This shows you average RPS, error rate, response times, and throughput across all samplers.
- Run the test and record your baseline. Then increase thread count incrementally to find where throughput plateaus or drops.
- Compare results across both A/B variants. This is the step most marketers skip entirely.
When interpreting your Aggregate Report, focus on three columns: throughput (RPS), error percentage, and average response time. If throughput stays flat while error rate climbs, your system is saturating. That is a red flag.
Pro Tip: Always run your throughput test at traffic levels that reflect your peak real-world load, not your average. A campaign email blast or a paid ad push can send 5 to 10 times your normal traffic in minutes. Testing at average conditions gives you a false sense of security. Check out these CRO speed tools that also factor in performance when running optimization experiments.
Understanding how to handle traffic surges through proper throughput testing separates teams that scale confidently from those that scramble after the fact.
Throughput in action: A/B testing and optimization
Once you know how to measure throughput, it's time to apply that knowledge. Here's what happens when you don't.
Imagine you're testing two landing page variants: Variant A uses a lightweight hero image and Variant B uses an interactive video player. In your standard A/B test, Variant B converts at 4.2% versus Variant A's 3.8%. You call it for Variant B. But when you run a throughput test on both, Variant A handles 250 RPS with a 0.05% error rate, while Variant B caps out at 90 RPS before errors start climbing. At real campaign scale, Variant B would throttle under load, serve broken pages to a third of your audience, and destroy the very conversion gains you measured.
This is exactly why performance testing of A/B variants matters so much. For SMBs, you should measure throughput in performance tests of variants to ensure optimizations like page load speed improvements do not degrade capacity. Critically, monitor TTFB (time to first byte) and LCP (largest contentful paint) deltas carefully, keeping differences under 50ms. Also, client-side tools can add 142ms latency to your measurements, which means your throughput data may be inflated relative to real user experience.
Here is a table of the key metrics every marketer should track during A/B throughput testing:
| Metric | What to watch | Target threshold |
|---|---|---|
| Throughput (RPS) | Stable under peak load | No drop greater than 10% at peak |
| TTFB delta | Difference between variants | Under 50ms |
| LCP delta | Difference between variants | Under 50ms |
| Error rate | Server errors during load | Below 0.1% |
| P95 response time | 95th percentile load time | Consistent across variants |
What should you check before declaring a test winner?
- Run both variants under identical simulated load. Do not test Variant A at 50 users and Variant B at 20.
- Confirm throughput holds at your traffic peak, not just at average load.
- Check error rates alongside RPS. A variant with high RPS and high errors is not actually winning.
- Measure TTFB and LCP, not just overall page load time. A fast LCP on a low-throughput server is misleading.
Pro Tip: Before you validate A/B tests for a final rollout decision, add a throughput check to your standard test review process. Even a 10-minute JMeter run at peak simulated load can prevent a costly mistake. When you analyze A/B test results, make throughput data a required column alongside conversion rate. And for broader campaign planning, throughput benchmarks help you build more realistic digital marketing A/B strategies that hold up in the real world.
Beyond the basics: Healthy throughput, benchmarks, and pitfalls
You've seen how throughput matters in A/B testing, but what counts as "good" and what do real-world numbers look like?
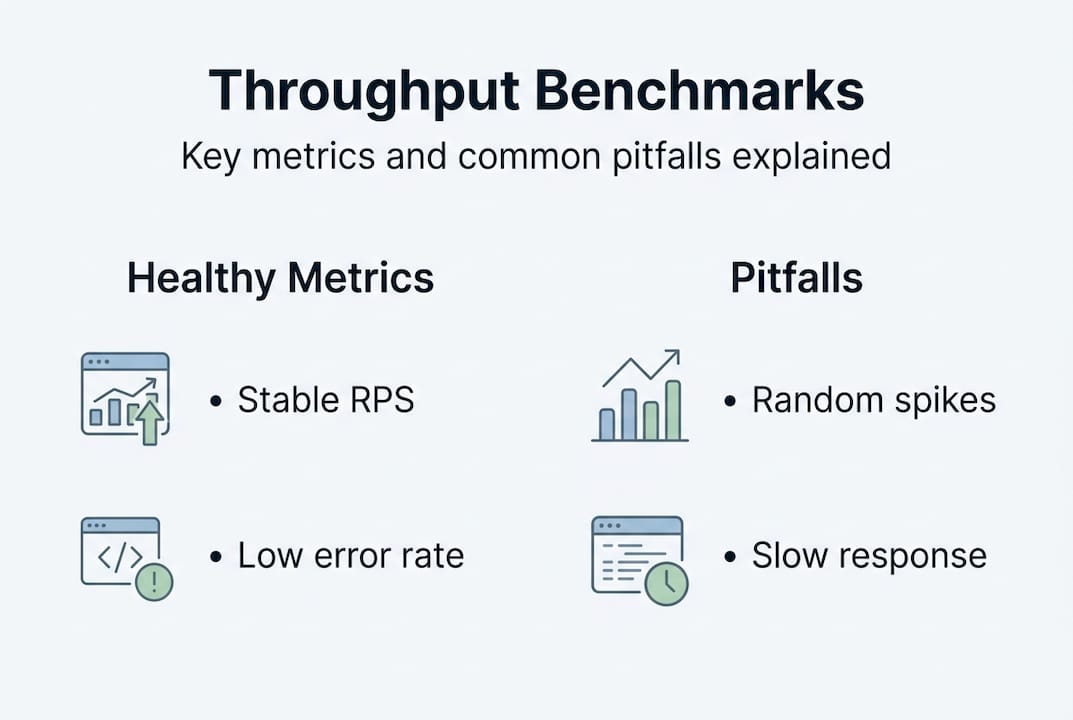
The answer depends heavily on your technology stack. Empirical benchmarks show significant variation: Rust and Quarkus-based systems handle roughly 4,700 to 4,800 RPS with average latency around 4ms, Go and Java systems reach 3,000 to 3,600 RPS, while JavaScript and Python systems performing I/O-bound work tend to fall in the 200 to 800 RPS range. For healthy ranges in load testing, the target is stable RPS under load with error rates below 0.1%.
Most SMB marketing sites are not running Rust backends, but these numbers give you important context. A well-optimized Node.js or WordPress site with a quality CDN can realistically sustain 300 to 600 RPS before problems appear, which is more than enough for most campaigns. The issue is not the number itself. It is when throughput becomes unstable under load, meaning it fluctuates widely or drops without warning.
"Throughput tells you not just how fast your system runs, but whether it can keep running at all when it matters most."
Here are the most common throughput pitfalls and bottlenecks SMB teams encounter:
- Database bottlenecks. When every page request triggers unoptimized database queries, throughput collapses fast under load. Caching and indexed queries fix this.
- Network saturation. High-resolution uncompressed images or video served from a slow origin server choke throughput well before your server capacity maxes out.
- Protocol overhead. Using HTTP/1.1 instead of HTTP/2 or HTTP/3 for pages with many assets means each asset requires its own connection, reducing actual throughput significantly.
- Saturation effects. This is when throughput plateaus while latency keeps climbing. Your system is processing at its limit and queuing everything else. Users experience this as slow but not broken, which makes it harder to detect without proper load testing.
- Shared hosting environments. Many SMBs use shared hosting that caps throughput at the infrastructure level. A perfectly coded page can still fail here under moderate traffic.
Healthy throughput for an SMB site is less about hitting a specific RPS number and more about consistency at your actual traffic volume. If your test shows 250 stable RPS with 0.04% error rate, that is a healthier system than one showing 400 RPS with 0.5% error rate and spiking P95 response times. Always analyze throughput alongside P95 response time and error rate, not in isolation, for conversion techniques that actually survive real traffic conditions.
The overlooked lesson: Why throughput is the marketer's secret conversion weapon
Now, let's step back and look at what most marketers still miss in the throughput story.
The conversation in most SMB marketing teams centers on page speed scores, Core Web Vitals, and LCP. These are important, absolutely. But they describe what one user experiences in one moment. Throughput describes what happens to all your users simultaneously. And that difference is where revenue is actually made or lost.
Here is the uncomfortable truth: a variant that wins a small-sample A/B test under light server load can actively harm your business at scale. You might double your ad spend, drive a thousand users to your "winning" variant, and watch it degrade in real time while your analytics dashboard cheerfully reports good average load times. This happens because most A/B tools, especially client-side ones, measure user experience at the point of delivery, not system health under concurrent demand.
Obsessing over page speed scores while ignoring throughput is like hiring the fastest runner on the team and ignoring whether the rest of the relay can keep up. Real conversion gains require both speed and capacity. The teams that understand this stop treating throughput as a "developer problem" and start treating it as a core marketing metric. If you're using tools for conversion rate and speed that do not account for throughput in their testing methodology, you are optimizing for conditions that may never reflect reality.
Throughput is not glamorous. It does not show up in most marketing dashboards. But it is the metric that separates campaigns that scale from ones that collapse under their own success.
Next steps: Optimize your performance testing with Stellar
Ready to take throughput and conversion testing to the next level? Here's where you start.
Understanding throughput is only valuable if your A/B testing platform can keep up with the demands of real performance optimization. That is exactly where Stellar comes in.

Stellar is built for SMB marketers who need fast, reliable experimentation without engineering overhead. With a lightweight 5.4KB script, Stellar minimizes the performance impact that client-side testing tools typically add, helping you get cleaner throughput measurements during your A/B tests. Real-time analytics, advanced goal tracking, and a no-code visual editor mean you can act on throughput insights immediately, without waiting on developers. Start free for sites with under 25,000 monthly tracked users and see how performance-first testing changes what you measure and what you win.
Frequently asked questions
How is throughput different from bandwidth and latency?
Throughput is the actual rate of processing requests, while bandwidth is the theoretical maximum and latency is the time delay for a single transaction. High throughput with low latency is ideal, but the two trade off under heavy load.
What is a healthy throughput value for SMB websites?
A healthy throughput keeps requests per second stable under load with error rates below 0.1%, though exact values depend on your tech stack and typical traffic volume. Stable RPS under load with minimal errors is the target benchmark, not a specific number.
Can client-side A/B testing tools affect throughput measurements?
Yes. Client-side tools can add around 142 milliseconds of latency, which impacts both perceived speed and the accuracy of your throughput data during testing.
What's the best way to track throughput during testing?
Use load testing tools like JMeter or Gatling to monitor throughput and generate actionable reports. JMeter tracks throughput via its Aggregate Report listener, which shows RPS, error rates, and response times side by side.
Recommended
Published: 4/26/2026