
Understanding A/B Testing Success Rates: What You Need to Know
A/B testing lets companies compare two nearly identical versions of a webpage, app, or ad, and see which one convinces more people to act. Sometimes tiny changes in color or wording seem like minor tweaks but the impact can be massive. In fact, successful A/B tests can raise conversion rates anywhere from 10% to as much as 300%. It turns out that most experiments actually fail, and only a handful unlock the real wins marketers are chasing.
Table of Contents
- What Is A/B Testing And How Does It Work?
- Why A/B Testing Success Rates Matter For Marketers
- Key Factors Influencing A/B Testing Success Rates
- Interpreting A/B Testing Results: Metrics And Insights
- Real-World Examples Of A/B Testing Success Rates In Action
Quick Summary
| Takeaway | Explanation |
|---|---|
| A/B testing compares two versions | It tests two variations to see which performs better, helping optimize user engagement. |
| Formulate a clear hypothesis | A specific hypothesis guides the test, focusing on measurable outcomes for improvement. |
| Statistical significance is essential | Understanding the importance of statistical results helps ensure test validity and actionable insights. |
| Success rates reflect marketing effectiveness | The percentage of successful tests indicates how well strategies influence user behavior and business outcomes. |
| Real-world applications drive results | A/B testing applies across various elements like email campaigns, landing pages, and e-commerce to boost performance. |
What is A/B Testing and How Does It Work?
A/B testing represents a strategic method of comparing two versions of a digital asset to determine which performs better. By presenting users with alternative experiences and measuring their responses, businesses can make data-driven decisions that optimize conversion rates and user engagement.
The Core Principles of A/B Testing
At its fundamental level, A/B testing involves creating two distinct versions of a webpage, email, advertisement, or app interface - labeled as Version A (control) and Version B (variant). These versions differ by one specific element, allowing marketers to isolate and understand the precise impact of that change.
The experimental process follows a structured approach:
- Identify a specific metric or goal you want to improve
- Create a hypothesis about what change might enhance performance
- Design two variations with a single, targeted difference
- Split your audience randomly into equal segments
- Expose each segment to a different version
- Collect and analyze statistical data on user interactions
According to Interaction Design Foundation, successful A/B testing requires careful experimental design and statistical rigor to ensure meaningful results.
Real-World Applications and Impact
A/B testing transcends simple webpage tweaks. Marketing teams use it to optimize everything from button colors and headline text to complex user journeys. Common scenarios include:
- Email subject line variations to improve open rates
- Landing page design modifications to increase conversions
- Call-to-action button placement and styling experiments
- Pricing page layout adjustments
- Product description and imagery testing
By systematically experimenting and measuring outcomes, organizations transform guesswork into precision strategy. Each test provides actionable insights that compound over time, driving continuous improvement in digital experiences.
The power of A/B testing lies not just in immediate results, but in building a culture of data-informed decision making that prioritizes actual user behavior over assumptions.
Why A/B Testing Success Rates Matter for Marketers
A/B testing success rates provide critical insights into the effectiveness of marketing strategies, enabling businesses to quantify the impact of their optimization efforts and make informed decisions about digital experiences.
Understanding Success Rate Significance
Success rates in A/B testing represent the percentage of experiments that generate statistically significant improvements in key performance indicators. These metrics help marketers understand which variations truly drive meaningful business outcomes, moving beyond simple data collection to actionable strategic insights.
Key factors influencing A/B testing success rates include:
- Sample size and statistical significance
- Clarity of experimental hypotheses
- Precise measurement of targeted metrics
- Quality of variations being tested
- Complexity of the digital asset
According to Harvard Business Review, successful A/B testing requires a rigorous approach that goes beyond surface-level modifications.
Economic and Strategic Implications
Marketing teams invest substantial resources in A/B testing, making success rates more than just numerical indicators. They represent direct financial impact and strategic validation. When an A/B test demonstrates a positive outcome, it can translate into:
- Increased conversion rates
- Higher revenue per user
- Improved customer engagement
- Enhanced user experience
- More efficient marketing spend
Typically, successful A/B tests range between 10-20% of total experiments, meaning not every test will yield significant improvements. This underscores the importance of systematic testing and continuous optimization.
By tracking and analyzing success rates, marketers transform experimental data into strategic intelligence, ensuring that each incremental change contributes meaningfully to overall business performance. The goal is not just running tests, but developing a sophisticated understanding of user behavior and preferences.

Key Factors Influencing A/B Testing Success Rates
A/B testing success relies on a complex interplay of strategic, technical, and analytical elements that determine the reliability and effectiveness of experimental outcomes. Understanding these critical factors helps marketers design more precise and meaningful tests.
Statistical and Experimental Design Considerations
Robust experimental design is fundamental to achieving meaningful A/B testing success rates. The structural integrity of a test determines its ability to generate actionable insights and statistically significant results.
Key experimental design factors include:

- Sample size and statistical power
- Precise definition of test objectives
- Randomization of test participants
- Minimal external interference
- Clear measurement of primary metrics
- Appropriate test duration
According to Interaction Design Foundation, successful testing requires meticulous planning and controlled experimental conditions.
Operational and Technical Influences
Technical constraints and operational capabilities significantly impact A/B testing performance. The underlying infrastructure, data collection mechanisms, and analytical tools play crucial roles in determining test outcomes.
Critical technical factors encompass:
- Website or platform loading speed
- Data tracking accuracy
- Compatibility across different devices
- Integration of testing tools
- Real-time data processing capabilities
- Traffic segmentation accuracy
Marketing teams must invest in robust technological frameworks that support comprehensive and reliable experimental processes. The quality of technical infrastructure directly correlates with the potential for generating meaningful insights.
Successful A/B testing transcends mere numerical comparisons. It represents a sophisticated approach to understanding user behavior, optimizing digital experiences, and making data-driven strategic decisions that drive tangible business growth.
The following table summarizes core elements and influences that shape the outcome of an A/B test, providing a scannable overview of factors marketers should consider for testing success.
| Factor Category | Description |
|---|---|
| Experimental Design | Involves planning, sample size, randomization, and defining clear test objectives |
| Statistical Considerations | Ensures sufficient power, precise measurement, and interpretable results |
| Operational Influences | Refers to the quality of infrastructure, test execution, and technical accuracy |
| Data Tracking & Analysis | Entails capturing accurate data and utilizing analytics tools for reliable measurement |
| Platform/Technical Factors | Includes loading speeds, device compatibility, and tool integration |
| Hypothesis Clarity | Relates to how well the test goal and predicted outcome are articulated |
| Variation Quality | Addresses the effectiveness and relevance of the test change |
Interpreting A/B Testing Results: Metrics and Insights
Interpreting A/B testing results requires a nuanced approach that goes beyond simple statistical comparison, demanding careful analysis of performance metrics, contextual understanding, and strategic decision-making.
Understanding Key Performance Metrics
Effective result interpretation hinges on selecting and understanding the right performance metrics. These metrics serve as critical indicators of experimental success, providing quantitative evidence about user behavior and digital experience optimization.
Primary metrics marketers typically track include:
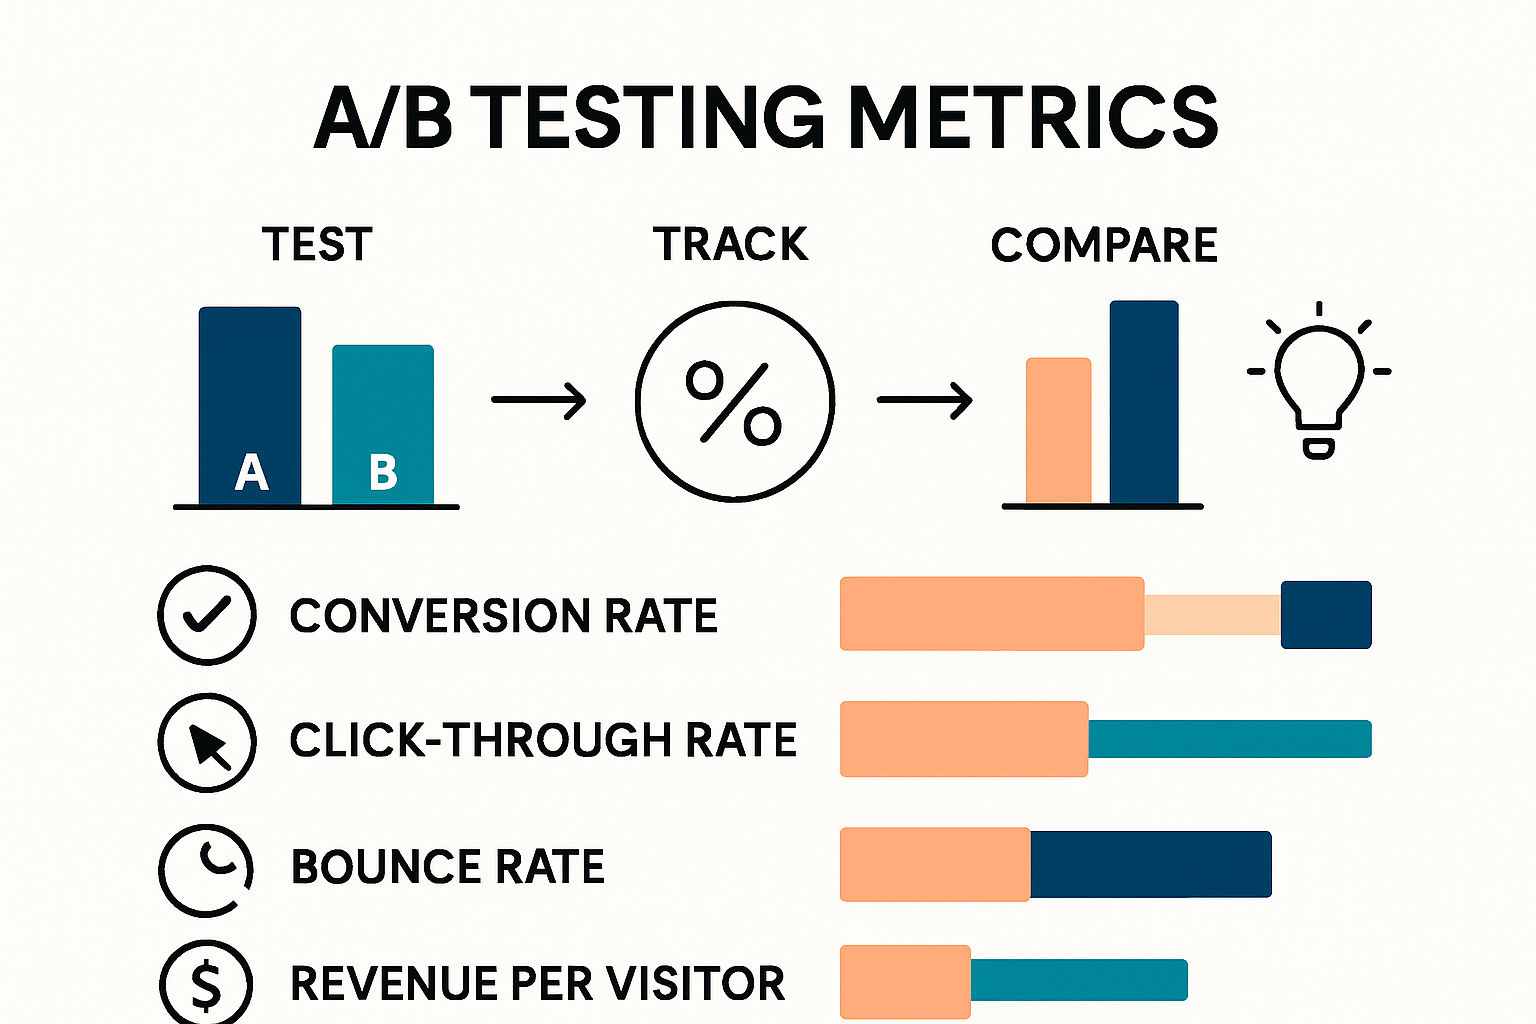
- Conversion rates
- Click-through rates
- Average time on page
- Bounce rates
- Revenue per visitor
- User engagement levels
According to National Institutes of Health Research, maintaining a consistent, predefined evaluation metric throughout the experiment ensures clarity and reduces interpretation complexity.
Statistical Significance and Practical Relevance
Statistical significance does not automatically translate to practical business value. Marketers must distinguish between mathematically significant results and those that generate meaningful improvements in business performance.
Key considerations for result interpretation include:
- Calculating confidence intervals
- Assessing practical significance
- Understanding effect size
- Evaluating potential implementation costs
- Considering long-term impact
- Identifying potential unintended consequences
Successful A/B testing goes beyond pure numerical analysis. It requires a holistic approach that balances statistical rigor with strategic business objectives. Marketers must view test results as insights that inform broader optimization strategies, not just isolated data points.
By developing a sophisticated understanding of metrics and their implications, organizations can transform experimental data into actionable intelligence that drives continuous improvement and user-centric design.
To help marketers focus on actionable outcomes, the table below organizes critical metrics for evaluating the impact of A/B testing as described in the article.
| Key Metric | What It Measures | Importance in A/B Testing |
|---|---|---|
| Conversion Rate | % of users who complete goal | Main indicator of test effectiveness |
| Click-Through Rate | % of users clicking links | Reflects engagement with offers or calls-to-action |
| Average Time on Page | Time spent on a page | Measures user interest and content relevance |
| Bounce Rate | % who leave after one page | Signals experience quality and relevance to the visitor |
| Revenue per Visitor | Average earnings per visitor | Connects test results to direct financial impact |
| User Engagement | Interaction frequency/quality | Provides insight into behavior beyond primary conversion metrics |
Real-World Examples of A/B Testing Success Rates in Action
Real-world A/B testing demonstrates the transformative potential of data-driven optimization across diverse digital platforms, revealing how strategic experimentation can unlock significant performance improvements and business value.
E-commerce and Conversion Rate Optimization
E-commerce platforms leverage A/B testing to fine-tune user experiences and maximize conversion rates. These experiments often yield remarkable insights into user behavior and design preferences.
Notable e-commerce A/B testing scenarios include:
- Button color and placement modifications
- Product page layout redesigns
- Checkout process simplification
- Pricing strategy experiments
- Promotional messaging variations
According to Conversion Rate Experts, successful e-commerce A/B tests can generate conversion rate improvements ranging from 10% to 300%, depending on the complexity of the intervention.
Digital Marketing and User Engagement
Marketing teams utilize A/B testing to optimize communication strategies and enhance user engagement across multiple channels. These experiments provide granular insights into audience preferences and behavioral triggers.
Key marketing A/B testing applications include:
- Email subject line optimization
- Landing page design variations
- Advertisement headline testing
- Call-to-action phrasing experiments
- Social media content formatting
Successful A/B tests transform marketing efforts from intuition-based to data-driven strategies. By systematically testing and measuring variations, organizations can unlock nuanced understanding of their target audience's preferences and behaviors.
These real-world examples illustrate that A/B testing is not merely a technical exercise but a strategic approach to continuous improvement, enabling businesses to make informed decisions that directly impact performance and user experience.
Supercharge Your A/B Testing Results With Stellar
Are you tired of running experiments that never seem to move the needle or feeling frustrated by the complexity of traditional A/B testing tools? This article showed that real success in A/B testing depends on tools that let you test with speed, precision, and clear insights. If you want higher success rates and faster iteration, you need a platform built for marketers who care about performance and simplicity.

Stop letting technical barriers or slow tools hold your business back. Take charge of your testing velocity with Stellar’s lightweight, no-code solution. Experience how our visual editor and real-time analytics make it easy to run experiments, track real-world impact, and achieve the performance gains discussed in this guide. Visit https://gostellar.app now to try Stellar for free, and turn your A/B tests into real business wins today.
Frequently Asked Questions
What factors influence A/B testing success rates?
Key factors influencing A/B testing success rates include sample size, clarity of experimental hypotheses, accuracy of targeted metrics, and the quality of variations being tested.
How can I improve my A/B testing results?
To improve A/B testing results, focus on robust experimental design, ensure a sufficient sample size for statistical significance, randomize user segments, and minimize external interference during the test.
What metrics should I track during A/B testing?
Important metrics to track during A/B testing include conversion rates, click-through rates, average time on page, bounce rates, and revenue per visitor to evaluate user behavior and performance accurately.
Is statistical significance the same as practical relevance in A/B testing?
No, statistical significance does not necessarily indicate practical business value. It's important to assess not just if results are statistically significant, but also whether they lead to meaningful improvements in business performance.
Recommended
Published: 8/24/2025