
Understanding Why A/B Tests Fail: Key Reasons Explained
A/B testing is the gold standard for improving websites and apps, with over 77 percent of organizations using it to make better product decisions. Yet, most people think running a simple split test guarantees smarter business choices. The truth is even top companies like Microsoft have seen how a single testing mistake can quietly tank results and waste resources.
Table of Contents
- Defining A/B Testing And Its Purpose
- The Importance Of Reliable Data In A/B Testing
- Common Pitfalls Leading To A/B Test Failures
- Understanding Statistical Significance And Misinterpretations
- Real-World Examples Of A/B Test Failures
Quick Summary
| Takeaway | Explanation |
|---|---|
| A/B Testing Enhances Decision-Making | This method allows businesses to test variations, reducing risks before full implementation. |
| Reliable Data is Crucial | High-quality data ensures valid conclusions and effective strategic decisions in A/B testing. |
| Avoid Common Testing Pitfalls | Many test failures arise from statistical errors; proper planning can mitigate these risks. |
| Understand Statistical Significance | Misinterpretations of statistical significance can lead to flawed conclusions and poor decisions. |
| Learn from Real-World Failures | Analyzing testing failures in other companies can provide valuable insights for improving your own strategies. |
Defining A/B Testing and Its Purpose
A/B testing represents a strategic method of data-driven experimentation used by businesses to make informed decisions about digital experiences. Nielsen Norman Group research defines it as a randomized experiment comparing two variants to determine which performs better for a specific conversion goal.
The Core Mechanics of A/B Testing
At its fundamental level, A/B testing involves creating two different versions of a webpage, email, or app interface.
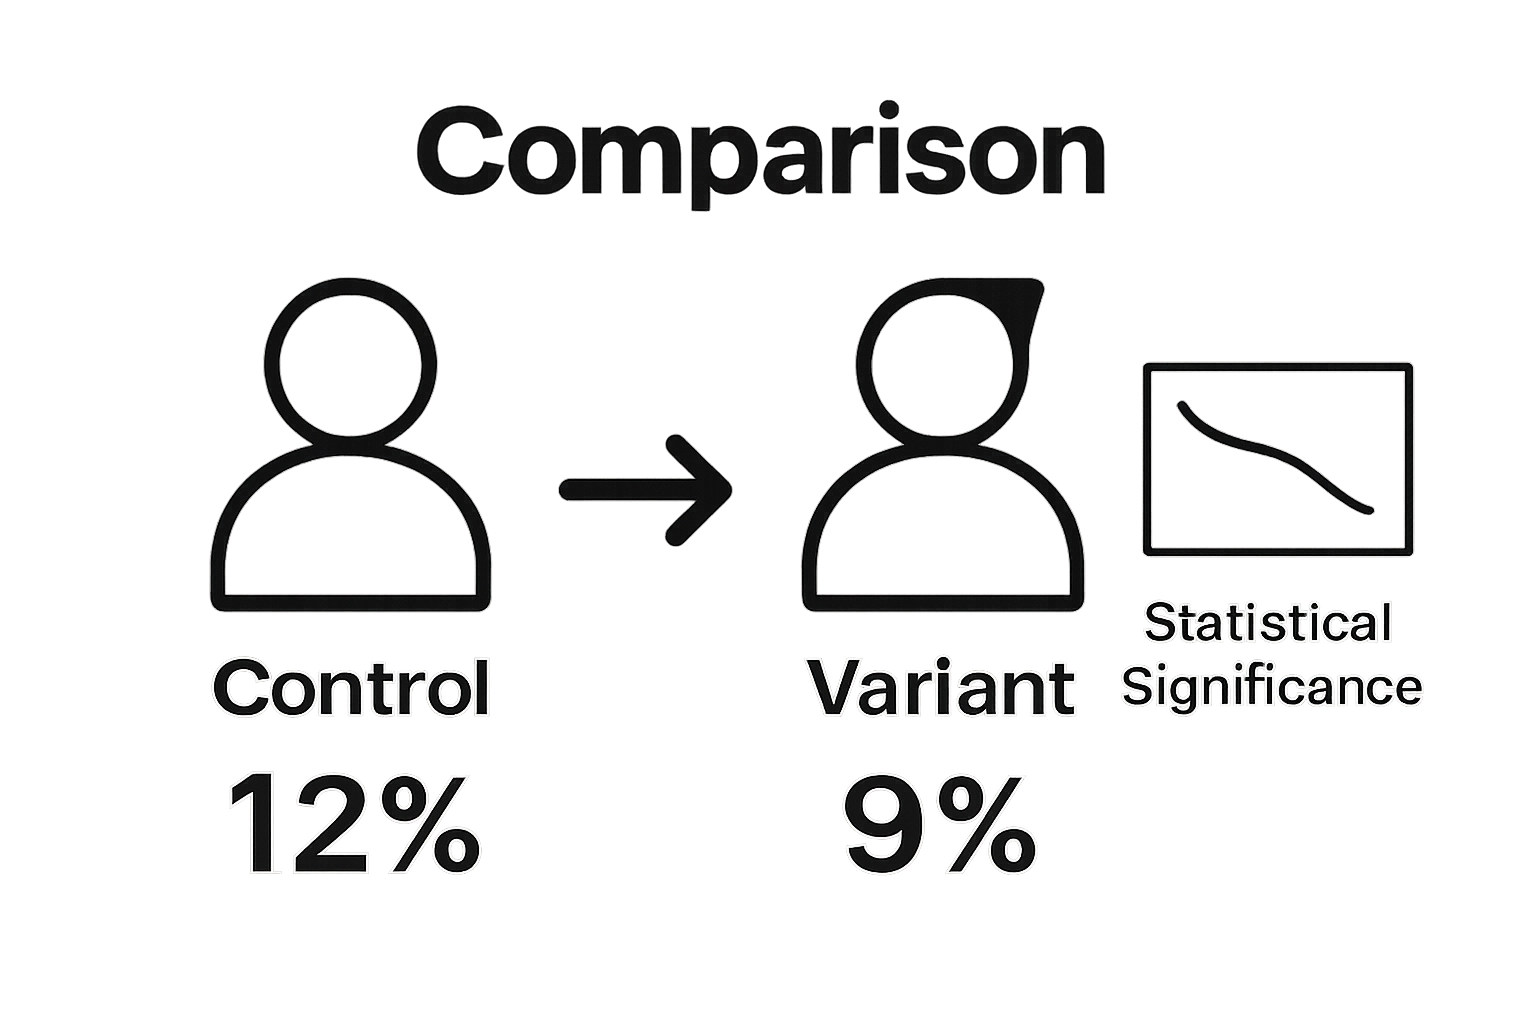 Version A serves as the control (existing design), while Version B introduces a strategic modification. Users are randomly divided into two groups, with each group experiencing one version, allowing precise measurement of performance differences.
Key elements in A/B testing include:
- Control Group: The original version representing current design
- Variant Group: The modified version testing a new hypothesis
- Statistical Significance: Determining whether observed differences are meaningful
Why Businesses Implement A/B Testing
Businesses leverage A/B testing as a critical optimization tool. Optimizely's research highlights that organizations use this method to reduce risks associated with design changes by testing modifications on a small user segment before full implementation.
The strategic advantages include:
- Minimizing guesswork in product and marketing decisions
- Improving user experience through data-driven insights
- Increasing conversion rates with empirical evidence
For those wanting to understand more about testing strategies, read our comprehensive guide on A/B testing fundamentals.
Successful A/B testing requires meticulous planning, clear hypotheses, and robust statistical analysis to extract meaningful insights that drive meaningful business improvements.
The Importance of Reliable Data in A/B Testing
Reliable data forms the backbone of successful A/B testing, transforming experimental insights from guesswork into actionable strategic decisions. Scientific research from the National Institutes of Health emphasizes that high-quality data is critical for ensuring the validity and reproducibility of experimental findings.
Characteristics of Reliable A/B Testing Data
Quality data in A/B testing encompasses several crucial dimensions. Researchers must ensure their data collection processes are robust, unbiased, and statistically representative. This means implementing stringent sampling techniques, minimizing external interference, and maintaining consistent measurement protocols.
Key characteristics of reliable data include:
- Sample Size Adequacy: Sufficient participants to draw meaningful conclusions
- Data Consistency: Uniform collection methods across test variants
- Minimal External Bias: Controlled testing environments
- Precise Tracking: Accurate measurement of relevant metrics
Consequences of Unreliable Data
When A/B testing relies on flawed or incomplete data, organizations risk making misguided decisions that can negatively impact user experience and business performance. Inaccurate data interpretation might lead to implementing changes that decrease conversion rates, alienate users, or waste valuable resources.
Potential risks associated with unreliable data include:
- Incorrect strategic pivots
- Wasted development resources
- Potential user experience degradation
- Misallocation of marketing budgets
Learn more about advanced data analysis techniques for A/B testing, which can help mitigate these risks and enhance the reliability of your experimental insights.
Ultimately, reliable data transforms A/B testing from a speculative exercise into a precision instrument for continuous improvement, enabling businesses to make confident, evidence-based decisions that drive meaningful growth.
To deepen understanding of reliable vs. unreliable data in A/B testing, the following table highlights distinguishing characteristics and their business impact.
| Data Characteristic | Reliable Data | Unreliable Data |
|---|---|---|
| Sample Size | Sufficient to draw meaningful conclusions | Too small, leading to inconclusive results |
| Data Consistency | Uniform collection methods | Inconsistent or varied data collection |
| Bias Control | Testing environment is tightly controlled | External factors introduce bias |
| Tracking Accuracy | Metrics measured precisely | Metrics are inaccurate or incomplete |
| Impact on Decisions | Enables confident, valid decisions | Leads to misguided or risky choices |
Common Pitfalls Leading to A/B Test Failures
A/B testing can quickly become a complex endeavor fraught with potential missteps that undermine experimental integrity. Research from the National Institutes of Health highlights the critical importance of understanding and avoiding common experimental design flaws that can compromise test results.
Fundamental Statistical and Design Errors
Many A/B test failures stem from fundamental statistical and methodological mistakes that introduce bias or reduce the reliability of experimental outcomes. These errors often emerge from insufficient planning, inadequate sample sizes, or improper randomization techniques.
Critical statistical pitfalls include:
- Premature Stopping: Concluding tests before achieving statistical significance
- Sample Size Insufficiency: Using too few participants to draw meaningful conclusions
- Ignoring Statistical Variance: Failing to account for natural fluctuations in data
- Multiple Hypothesis Testing: Increasing chances of false positive results
Contextual and Operational Challenges
Beyond statistical errors, A/B tests can fail due to complex operational and contextual challenges that disrupt experimental integrity. These challenges often involve external factors, technical limitations, or misaligned testing strategies that prevent obtaining accurate insights.
Significant operational risks encompass:
- Inadequate user segmentation
- Seasonal or temporal bias in testing periods
- Technical implementation inconsistencies
- Lack of clear, measurable hypotheses
Explore our comprehensive A/B testing checklist for avoiding common mistakes to ensure more reliable and actionable experimental results.
Successful A/B testing requires meticulous attention to methodological details, robust statistical frameworks, and a nuanced understanding of potential experimental vulnerabilities. By recognizing and proactively addressing these common pitfalls, organizations can transform their testing processes from risky guesswork into precision-driven strategic optimization.
To clarify some of the most frequent causes behind failed A/B tests, the table below categorizes key statistical and operational pitfalls alongside brief descriptions.
| Cause of A/B Test Failure | Type | Description |
|---|---|---|
| Premature Stopping | Statistical | Ending tests too early, before achieving statistical significance |
| Sample Size Insufficiency | Statistical | Using too few participants to produce valid conclusions |
| Ignoring Statistical Variance | Statistical | Failing to account for natural data fluctuations |
| Multiple Hypothesis Testing | Statistical | Testing several changes increases likelihood of false positives |
| Inadequate User Segmentation | Operational | Not dividing users effectively, leading to biased results |
| Seasonal or Temporal Bias | Operational | Running tests during abnormal periods, skewing outcomes |
| Technical Implementation Inconsistencies | Operational | Differences in setup or rollout introducing unintentional bias |
| Lack of Clear, Measurable Hypotheses | Operational | Unclear goals make assessing test success difficult |

Understanding Statistical Significance and Misinterpretations
Statistical significance represents a critical yet frequently misunderstood concept in A/B testing that can dramatically influence experimental conclusions. Nature scientific research reveals that statistical significance is often conflated with practical significance, leading to potentially misleading interpretations of experimental data.
Defining Statistical Significance
Statistical significance measures the probability that an observed difference between test variants occurred by chance rather than through a genuine effect. The standard threshold is typically a p-value of 0.05, which indicates a 95% confidence that the results are not random. However, reaching this threshold does not automatically guarantee meaningful or actionable insights.
Key components of statistical significance include:
- Confidence Level: The probability of correctly rejecting the null hypothesis
- P-Value: Quantitative measure of statistical evidence
- Sample Size: Determines the reliability of statistical conclusions
- Effect Size: Magnitude of the observed difference between variants
Common Misinterpretation Traps
Marketers and researchers frequently fall into interpretation traps that can lead to incorrect conclusions. These misunderstandings often stem from oversimplifying complex statistical concepts or misapplying statistical principles without considering contextual nuances.
Significant misinterpretation risks include:
- Assuming statistical significance equals practical importance
- Overlooking the actual magnitude of observed differences
- Failing to consider real-world business context
- Misunderstanding the limitations of statistical methods
Explore our comprehensive guide to understanding p-values and statistical power to develop more nuanced experimental insights.
Ultimately, successful A/B testing requires a sophisticated approach that balances statistical rigor with practical business understanding, recognizing that numbers alone cannot tell the complete story of experimental outcomes.
Real-World Examples of A/B Test Failures
A/B testing failures are not theoretical constructs but tangible challenges that can significantly impact business strategies and performance. ACM Queue research reveals how even sophisticated technology companies can experience critical setbacks from misinterpreted experimental results.
Technology Company Test Failures
Tech giants have encountered substantial challenges in their A/B testing methodologies, demonstrating that even organizations with advanced analytical capabilities are susceptible to experimental pitfalls. Microsoft Bing, for instance, experienced a notable failure when page layout modifications appeared to improve engagement metrics but simultaneously decreased site performance, ultimately negating potential user experience gains.
Characteristic failure scenarios in technology testing include:
- Overlooking secondary performance metrics
- Misaligning short-term gains with long-term user experience
- Failing to consider holistic system impacts
- Inadequate comprehensive performance monitoring
E-commerce and Marketing Test Misadventures
Retail and marketing sectors frequently encounter A/B testing challenges that reveal the complexity of experimental design. Seemingly minor changes can produce unexpected and counterintuitive results that challenge conventional wisdom about user behavior and conversion optimization.
Significant testing risks in marketing domains involve:
- Misinterpreting conversion rate fluctuations
- Implementing changes without comprehensive user journey analysis
- Neglecting audience segmentation nuances
- Assuming statistical significance guarantees universal applicability
Explore our comprehensive guide to understanding A/B testing success rates to develop more robust experimental strategies.
These real-world examples underscore a critical lesson: successful A/B testing demands more than statistical acumen. It requires a holistic understanding of user behavior, technical ecosystem interactions, and the subtle interplay between experimental variables and actual user experiences.
Eliminate A/B Testing Guesswork With Stellar’s Reliable, Fast Solutions
If you feel frustrated by unreliable data, slow experiments, and technical complexity sabotaging your A/B tests, you are not alone. As described in the article, pitfalls such as premature test stopping, small sample sizes, and inconsistent tracking can make results misleading, waste resources, and shake your confidence in decision-making. You deserve a solution that removes these obstacles, puts accurate insights within reach, and helps you grow with certainty.

Ready to experience data you can truly trust and experimentation that never drags down your site? Discover Stellar’s A/B testing tool for fast, credible, and no-code optimization. Take advantage of a visual editor, advanced goal tracking, and real-time analytics—all engineered for marketers who want results, not headaches. Don’t miss your opportunity to transform test results into real business growth. Start with Stellar now and move past A/B test failures for good.
Frequently Asked Questions
What are some common reasons for A/B test failures?
A/B test failures can commonly result from inadequate sample sizes, premature test stopping, insufficient user segmentation, and overlooking secondary performance metrics.
How can statistical significance be misinterpreted in A/B testing?
Statistical significance can be misinterpreted when it is assumed that statistical significance equates to practical importance, leading to decisions based on data without considering real-world implications.
What risks do unreliable data present in A/B testing?
Unreliable data can lead to incorrect strategic pivots, wasted development resources, and degraded user experience due to misguided changes based on flawed insights.
Why is reliable data essential for successful A/B testing?
Reliable data ensures that insights obtained from A/B testing are valid, reproducible, and actionable, allowing businesses to make confident, evidence-based decisions that enhance user experience and improve conversion rates.
Recommended
- A B Testing Meaning: Uncover Data-Driven Insights for Better Conversions
- A/B Testing Digital Marketing: Strategies and Best Practices 2025
- Understanding A/B Testing Success Rates: What You Need to Know
- Analyzing Split Test Results: Proven Methods for CRO Marketers 2025
- Converting Website Traffic: Proven Strategies for 2025
Published: 9/27/2025