
Web analysis: the marketer's guide to data-driven wins
TL;DR:
- Web analysis involves interpreting data to understand user behavior and improve marketing decisions.
- Proper web analysis guides effective A/B testing, leading to bigger and faster conversion lifts.
- Using key metrics and tools thoughtfully prevents analysis paralysis and unreliable test results.
Web analysis is not the same as glancing at your traffic dashboard and calling it a day. Most marketers treat it like a passive activity, checking visitor counts and bounce rates without ever asking the deeper question: why are users behaving this way? That gap between looking at data and actually interpreting it is where conversion opportunities are lost. This guide breaks down what web analysis really means for growth-focused teams, which metrics move the needle, how it feeds smarter A/B testing, and where most marketers go wrong. By the end, you will have a clear framework for turning raw web data into higher-converting experiments.
Table of Contents
- What is web analysis? A real definition for marketers
- Why web analysis matters for A/B testing and conversions
- Key metrics and tools for practical web analysis
- Common pitfalls and expert tips for successful web analysis
- Why most marketers overlook the true power of web analysis
- Take your web analysis further with the right tools
- Frequently asked questions
Key Takeaways
| Point | Details |
|---|---|
| Web analysis powers A/B testing | Understanding web analysis enables marketers to design smarter tests and drive better conversion rates. |
| Measure what matters | Focusing on actionable metrics like conversion rate leads to more meaningful optimization. |
| Avoid common pitfalls | Recognizing statistical vs. practical significance and validating setups helps avoid costly mistakes. |
| Connect data to action | Turning insights into experiments and iterative improvements creates long-term marketing growth. |
What is web analysis? A real definition for marketers
Web analysis is the systematic process of collecting, measuring, and interpreting web data to optimize your online marketing. Notice the key word: interpreting. Collecting data is table stakes. Every analytics tool does that. What separates web analysis from basic tracking is the deliberate effort to understand what the data means and what action to take next.
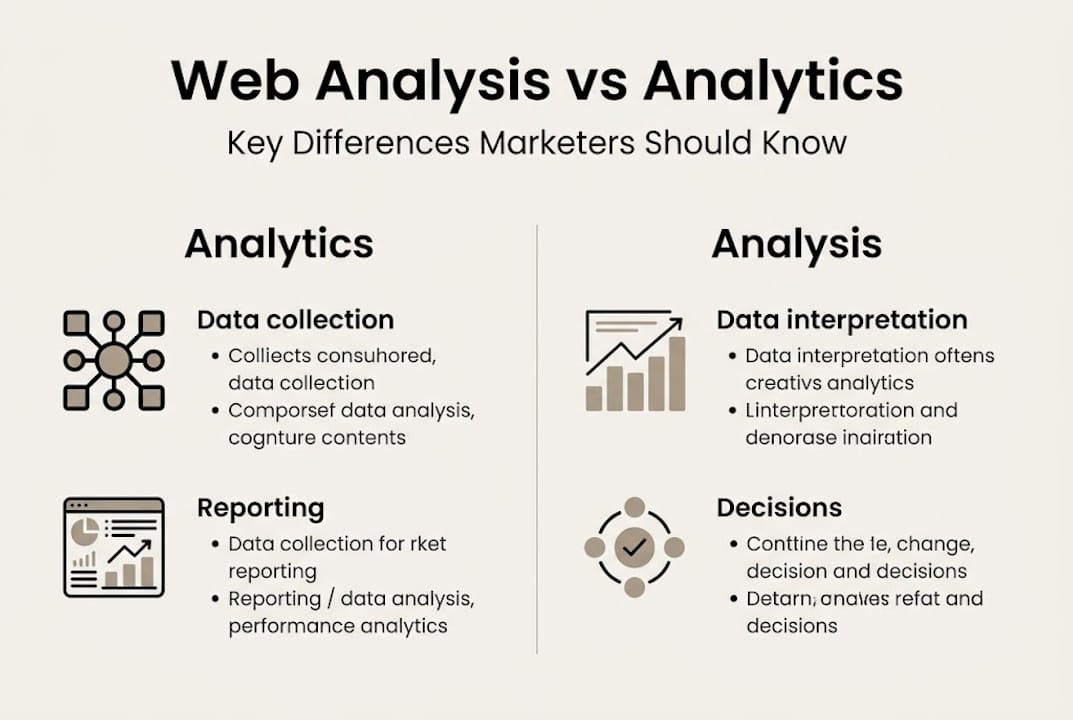
Here is where the confusion starts. Many marketers use "web analytics" and "web analysis" interchangeably, but they are meaningfully different.
| Aspect | Web analytics | Web analysis |
|---|---|---|
| Primary focus | Data collection and reporting | Data interpretation and decision-making |
| Output | Dashboards and reports | Hypotheses and actions |
| Who drives it | Tools and automation | Marketers and analysts |
| Goal | Track what happened | Understand why it happened |
| Connection to testing | Indirect | Direct input into A/B testing |
Web analytics gives you the numbers. Web analysis gives you the story behind those numbers. If you know that your landing page has a 72% bounce rate, that is web analytics. If you know that users are bouncing because the call to action is below the fold and the headline does not match their search intent, that is web analysis.
The core activities in web analysis include:
- Analyzing user behavior: Where do visitors click, scroll, or stop? What paths do they take before converting?
- Evaluating traffic sources: Are paid visitors converting better than organic ones? Is a specific campaign driving low-quality traffic?
- Measuring conversions: Which pages and elements actually lead to sign-ups, purchases, or other goals?
- Identifying friction points: Where do users abandon a form, exit a funnel, or stop engaging?
These activities directly feed into stronger A/B test design. A/B testing relies on measuring primary metrics like conversion rate and using statistical methods to determine whether observed differences are real, not random. You cannot design a meaningful test without first doing the web analysis to know which page element is worth testing and what outcome to measure.
Think of it this way: web analysis is what you do before and after an A/B test. Before the test, it identifies what to test and why. After the test, it helps you understand what the results actually mean for your business.
Why web analysis matters for A/B testing and conversions
Now that we know what web analysis is, let us see how it actually drives more effective A/B testing and business results.

The most expensive mistake a marketer can make is running an A/B test on the wrong thing. Testing a button color when the real problem is your value proposition wastes time, traffic, and budget. Web analysis prevents that by surfacing the actual pain points in the user journey.
Here is a practical, step-by-step process for applying web analysis to A/B testing:
- Identify the problem page. Look at your conversion funnel. Which step has the sharpest drop-off? That is where your test should live.
- Diagnose the issue. Use behavior data, session recordings, and heatmaps to understand why users are leaving. Are they ignoring the CTA? Is the form too long?
- Form a specific hypothesis. "If we shorten the sign-up form from 7 fields to 3, conversion rate will increase by at least 15%." Vague hypotheses produce vague learnings.
- Choose your primary metric. Measuring conversion rate as the primary metric and ensuring statistical significance is what separates reliable A/B test results from misleading ones.
- Run the test and monitor secondary metrics. Watch for unintended effects on other KPIs (key performance indicators) like average order value or time on page.
To show the real-world impact, here is what happens when you run tests with and without web analysis guiding the process:
| Scenario | Test focus | Conversion lift | Time to insight |
|---|---|---|---|
| No prior analysis | Random element (button color) | 1.2% (not significant) | 6 weeks |
| Analysis-led testing | Form length (identified via funnel data) | 18.4% (significant) | 3 weeks |
| Analysis-led testing | Headline copy (identified via heatmaps) | 22.1% (significant) | 2 weeks |
The numbers tell the story. Analysis-led testing does not just produce bigger lifts; it produces them faster because you are starting from a position of knowledge, not guesswork. One common example: a SaaS team noticed in their web analysis that 63% of users who started a free trial sign-up were dropping off on step 2 of 3. They ran a test removing a required phone number field. Conversions on that step jumped 31%.
This is exactly the kind of insight you use when you want to validate marketing ideas before committing to a full redesign or development sprint.
Pro Tip: Do not just measure what users do. Look for patterns that reveal why they do it. A high exit rate on a pricing page means something very different from a high exit rate on a blog post. Context is everything.
Understanding A/B testing best practices alongside a solid web analysis routine is what separates teams with consistent conversion growth from teams that celebrate one win and then stagnate.
Key metrics and tools for practical web analysis
Understanding the value of web analysis brings us to a practical question: What do you actually measure, and with what tools?
Not every metric deserves equal attention. Tracking everything sounds thorough, but it often leads to analysis paralysis (the inability to act because there is too much data to process). Instead, focus on metrics that are directly tied to user decisions and business outcomes.
The core metrics for web analysis in an A/B testing context:
- Conversion rate: The percentage of visitors who complete a goal action. This is the primary A/B test metric and your north star for optimization.
- Bounce rate: The percentage of visitors who leave after viewing just one page. A high bounce rate on a landing page often signals a mismatch between ad promise and page content.
- Average session duration: How long users spend engaging with your content. Short sessions on deep-funnel pages suggest the content is not meeting expectations.
- User flow: The paths visitors take through your site. Unexpected exit points in the middle of a conversion funnel reveal where web analysis should focus first.
- Click-through rate (CTR): The percentage of visitors who click on a specific element. Useful for testing headlines, CTAs, and navigation links.
- Scroll depth: How far down a page users scroll. If 80% of users never reach your sign-up form, the form placement is worth testing.
Each of these metrics feeds directly into how you design your experiments. Effective A/B testing depends on measuring the right metrics and ensuring your experiment setup, including proper sample size calculation and statistical significance thresholds, is solid before you launch.
When it comes to tools, marketers at small to medium-sized businesses typically rely on a combination of platforms. Google Analytics 4 handles traffic and funnel data well. Hotjar or Microsoft Clarity provide session recordings and heatmaps. For testing, a lightweight A/B testing platform (more on that shortly) handles experiment management and result tracking.
For sample size, use this straightforward formula: n = 16 × p × (1 minus p) / MDE squared. Here, "p" is your baseline conversion rate, and "MDE" is the minimum detectable effect, or the smallest lift you actually care about. If your current conversion rate is 5% and you want to detect a 1 percentage point improvement, you need roughly 12,000 visitors per variant. Knowing this before you start prevents you from calling a winner too early.
Pro Tip: Run an A/A test (where both variants are identical) before any live A/B test. If an A/A test shows a significant difference, your tracking setup has a problem. Fix it first, or your test results will be meaningless. Also track guardrail metrics, metrics you want to make sure do not get worse during a test, alongside your primary goal metric.
Once you have results, knowing how to properly analyze test results is what determines whether your web analysis actually turns into better marketing.
Common pitfalls and expert tips for successful web analysis
Mastering the technical side is only half the battle. Many marketers struggle with common mistakes and missed insights that quietly undermine their analysis.
The most damaging mistake is treating statistical significance as the finish line. Just because a result reaches p < 0.05 (meaning there is less than a 5% chance the result is due to random variation) does not automatically mean you should ship the winning variant. You also need to ask: is this lift practically significant? As one important expert distinction makes clear:
"Distinguish statistical from practical significance. Even significant lifts under MDE may not justify development costs. Always use guardrail metrics and run A/A tests to validate your setup."
This is a critical nuance. A 0.3% lift in conversion rate might be statistically significant on a high-traffic site, but if implementing the winning variant requires two weeks of engineering work, the return on investment is questionable. You need both statistical and practical significance to make a confident decision.
Here are the five most common web analysis mistakes that marketers make:
- Peeking at results early. Checking your test daily and stopping it when you see a promising number inflates false positive rates dramatically. Set your duration upfront and stick to it.
- Ignoring sample size requirements. Running a test for three days with 400 visitors per variant and calling it conclusive is not analysis; it is wishful thinking.
- Confusing correlation with causation. Just because two metrics move together does not mean one caused the other. Web analysis requires critical thinking, not just pattern spotting.
- Testing too many elements at once. Multivariate tests require exponentially more traffic. For most SMBs, clean A/B tests on single elements produce faster, clearer learnings.
- Skipping post-test analysis. After a test concludes, many teams move on without documenting what they learned. This destroys the compounding value of web analysis over time.
Quick fixes for better interpretation include always documenting your hypothesis and expected outcome before the test starts, reviewing secondary metrics when your primary metric shows no lift (the effect might be showing up elsewhere), and building a shared test log that all team members can reference. This turns individual experiments into an organizational knowledge base.
Understanding A/B testing explained at a deeper level helps you avoid these pitfalls by grounding every decision in process, not instinct.
Why most marketers overlook the true power of web analysis
Here is an uncomfortable truth: most growth teams use web analysis to build dashboards, not to drive decisions. They pour effort into making data look beautiful in a reporting tool, then hold a weekly meeting where everyone nods at the charts and nothing changes.
The problem is structural. When analysis is disconnected from action, it becomes overhead, not advantage. True web analysis is not a reporting exercise; it is a discipline. Teams that consistently outperform their competitors are not the ones with the most data. They are the ones who treat every failed test as a learning, follow up on anomalies, and connect their analysis directly to their next experiment.
Following solid A/B testing best practices is not enough on its own if your web analysis process stops at the dashboard level. The real edge comes from building a culture where analysis leads to a documented hypothesis, that hypothesis leads to a test, and that test feeds back into refined analysis. Repetition of this cycle is what compounds into a genuine conversion rate advantage over time.
Take your web analysis further with the right tools
Ready to apply advanced web analysis for your campaigns? Here is where you can take your practice to the next level.

Stellar is built specifically for marketers and growth teams at small to medium-sized businesses who want to run smarter experiments without relying on developers. With a lightweight 5.4KB script that does not slow your site, a no-code visual editor, real-time analytics, and advanced goal tracking, Stellar gives you everything you need to close the gap between web analysis and action. You can start testing hypotheses immediately, track the metrics that matter, and make confident decisions faster. Explore Stellar's A/B testing platform and see how integrated analysis and testing can accelerate your conversion growth.
Frequently asked questions
How is web analysis different from web analytics?
Web analytics focuses on collecting data, while web analysis interprets that data to guide decisions and optimize marketing actions.
What is the most important metric in web analysis for A/B testing?
Conversion rate is the primary metric for A/B tests, since A/B testing methodology uses conversion rate as the standard comparison point between variants.
Do I need technical skills to start web analysis?
You do not need to code, but understanding key metrics and using simple tools is essential for effective web analysis that leads to actionable decisions.
Can too-small A/B tests give misleading results in web analysis?
Yes. Tests with inadequate sample size can lead to unreliable conclusions, and A/B testing reliability depends on properly calculated sample size before the test begins.
What's a quick expert tip for web analysis in A/B testing?
Always run A/A tests before A/B testing to validate your setup. Experts recommend A/A tests to catch tracking errors that would otherwise corrupt your results.
Recommended
Published: 4/26/2026